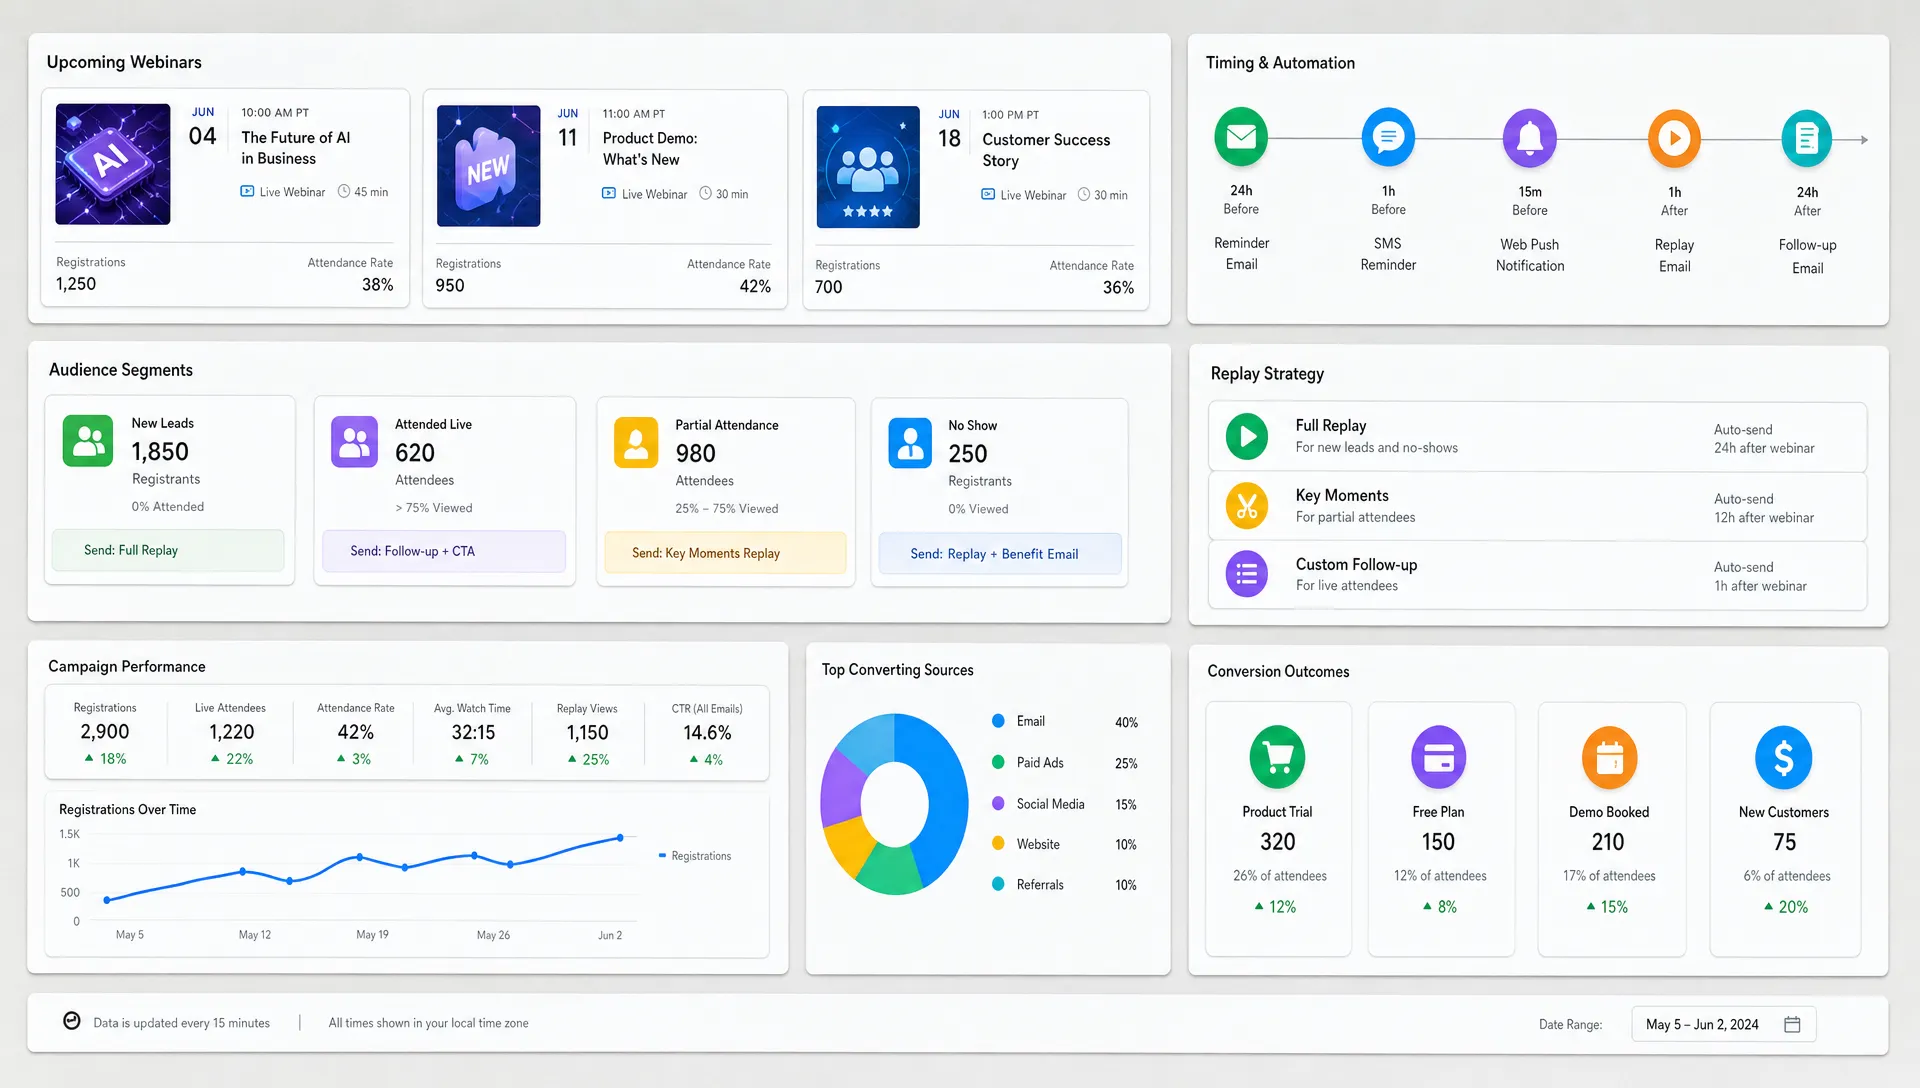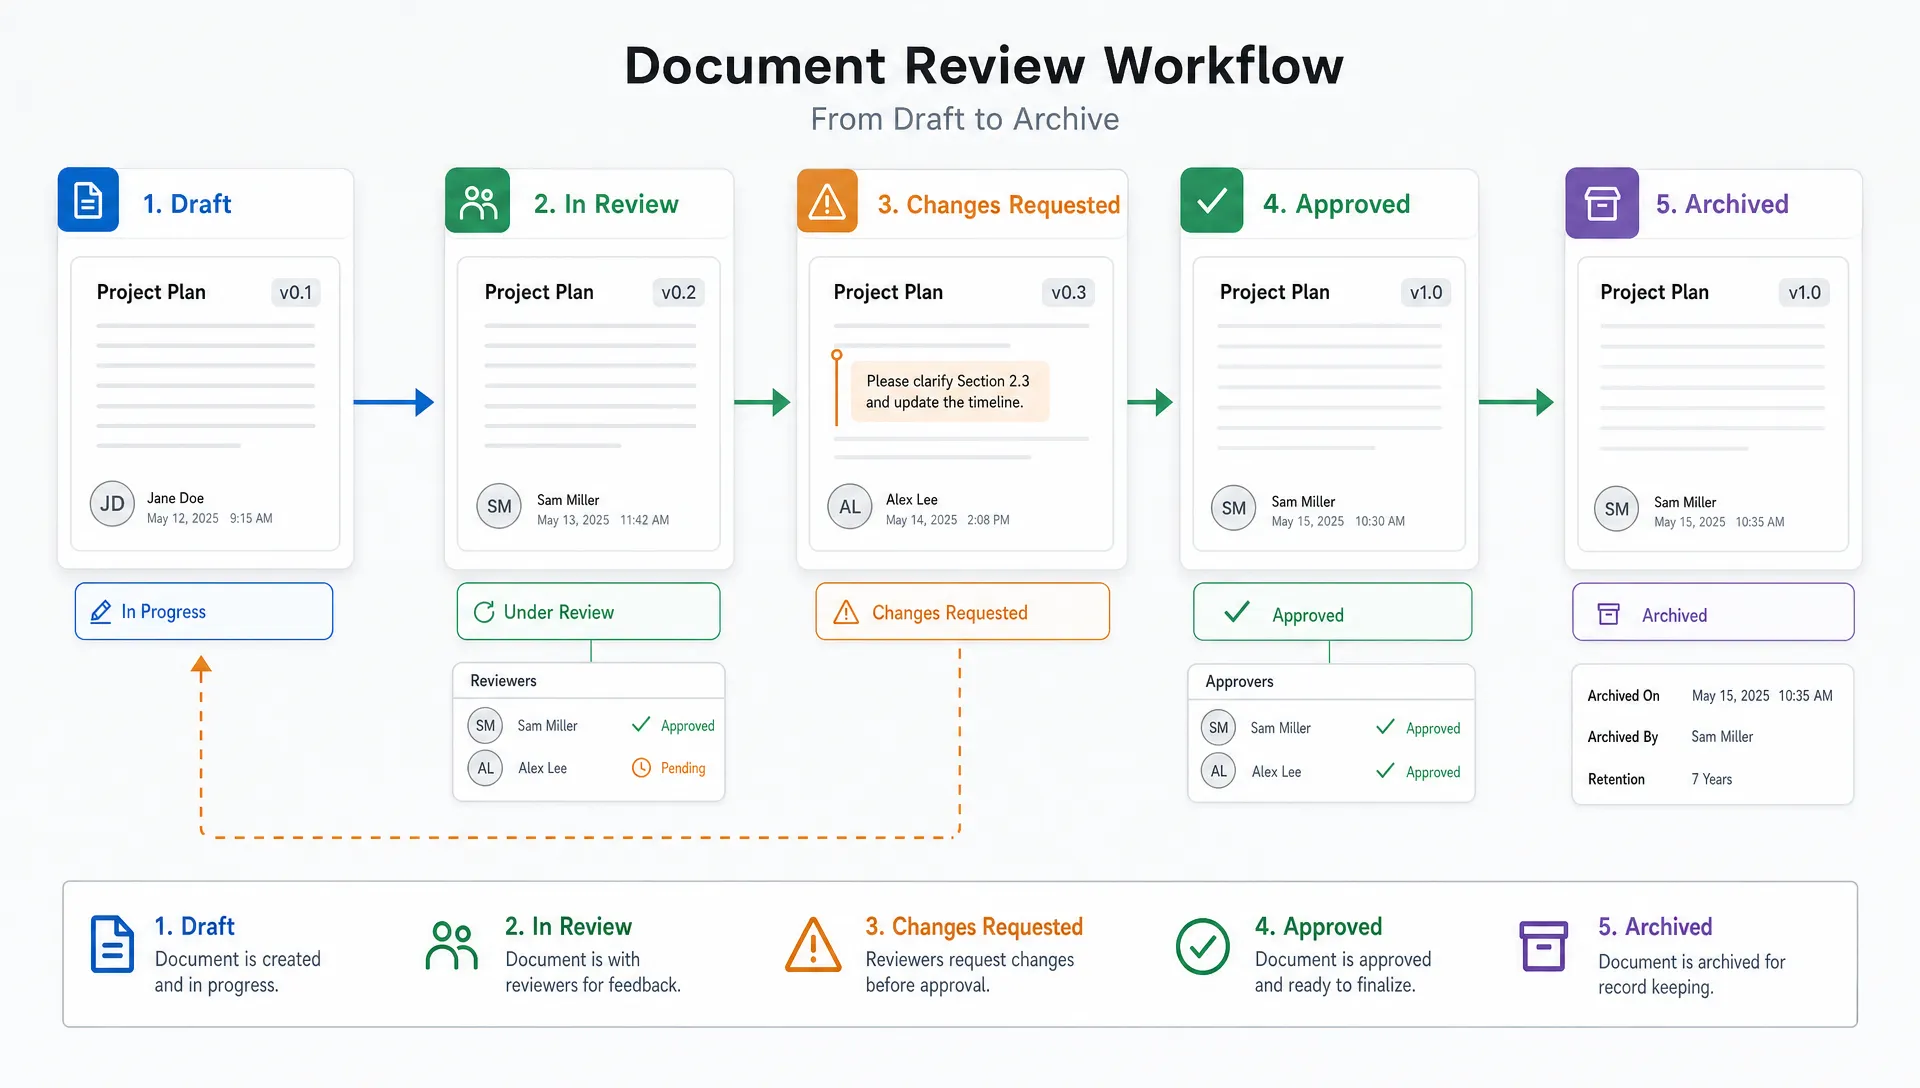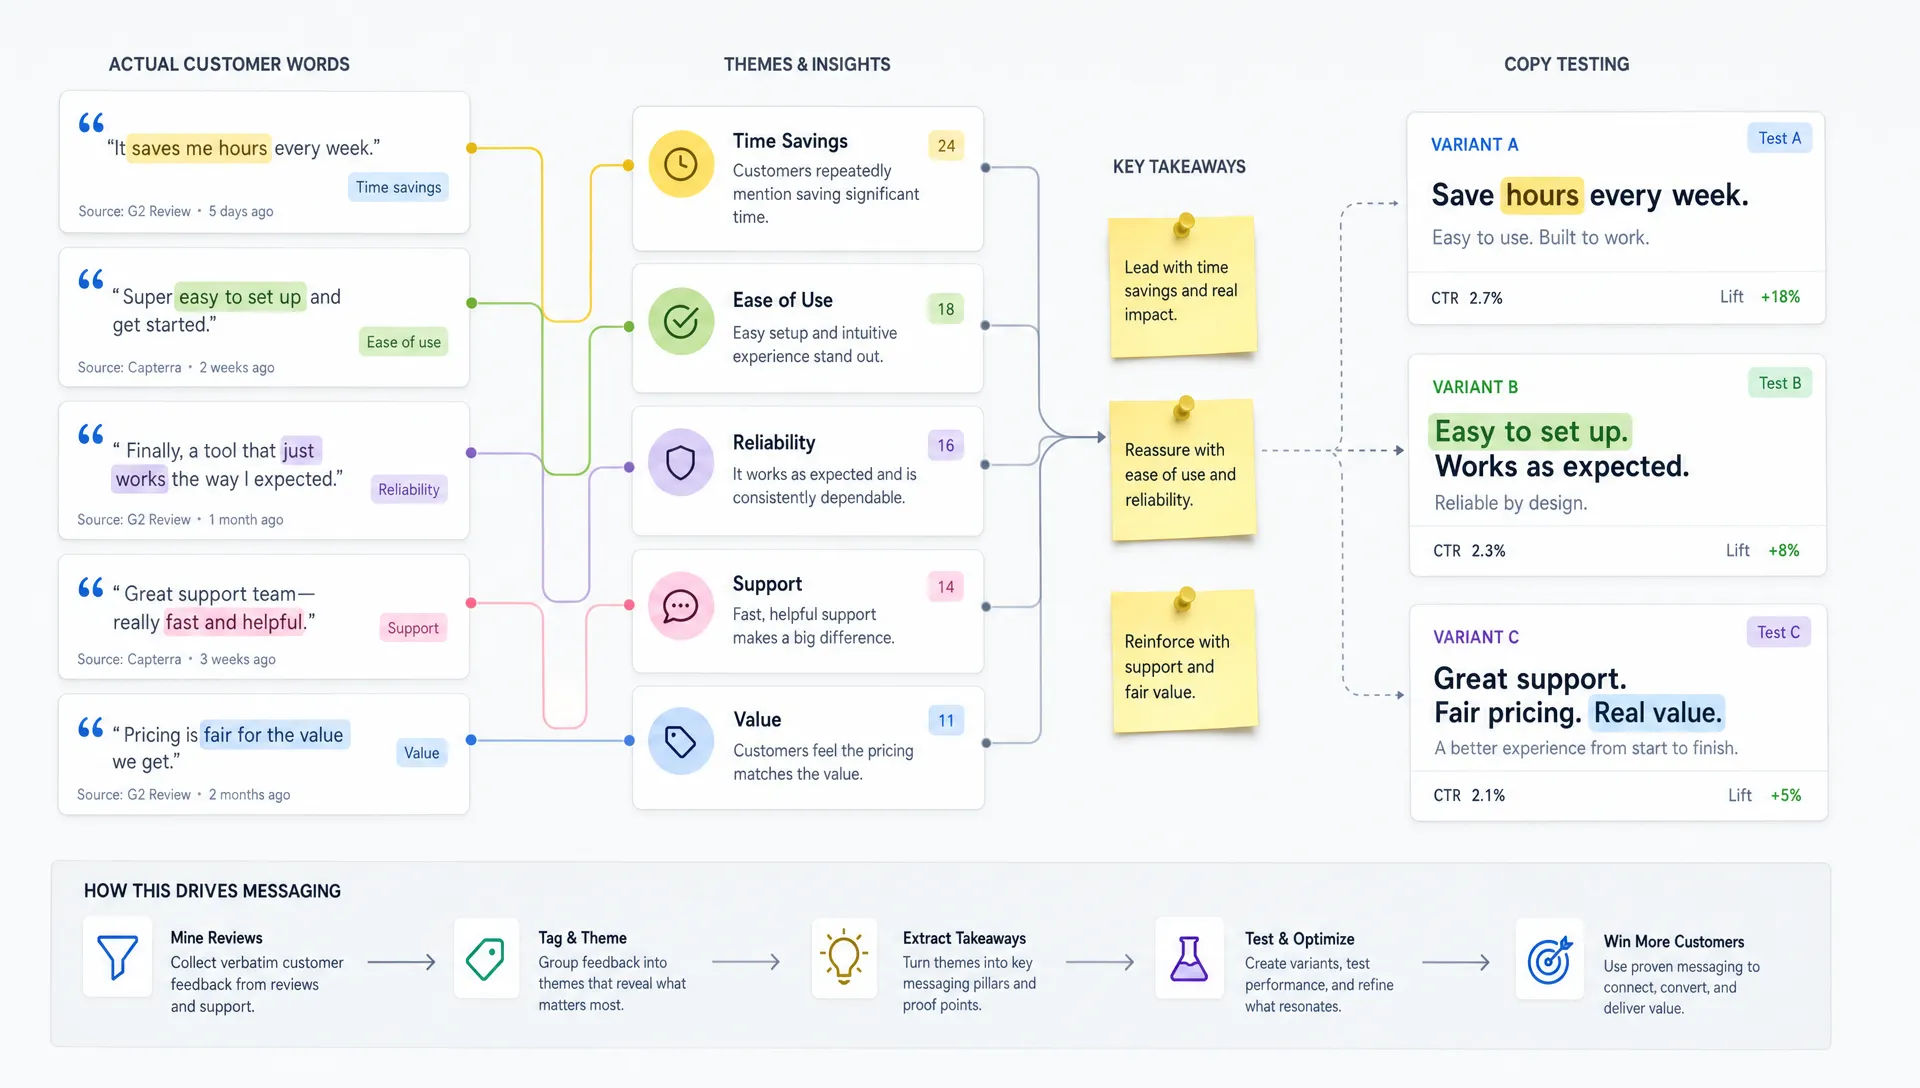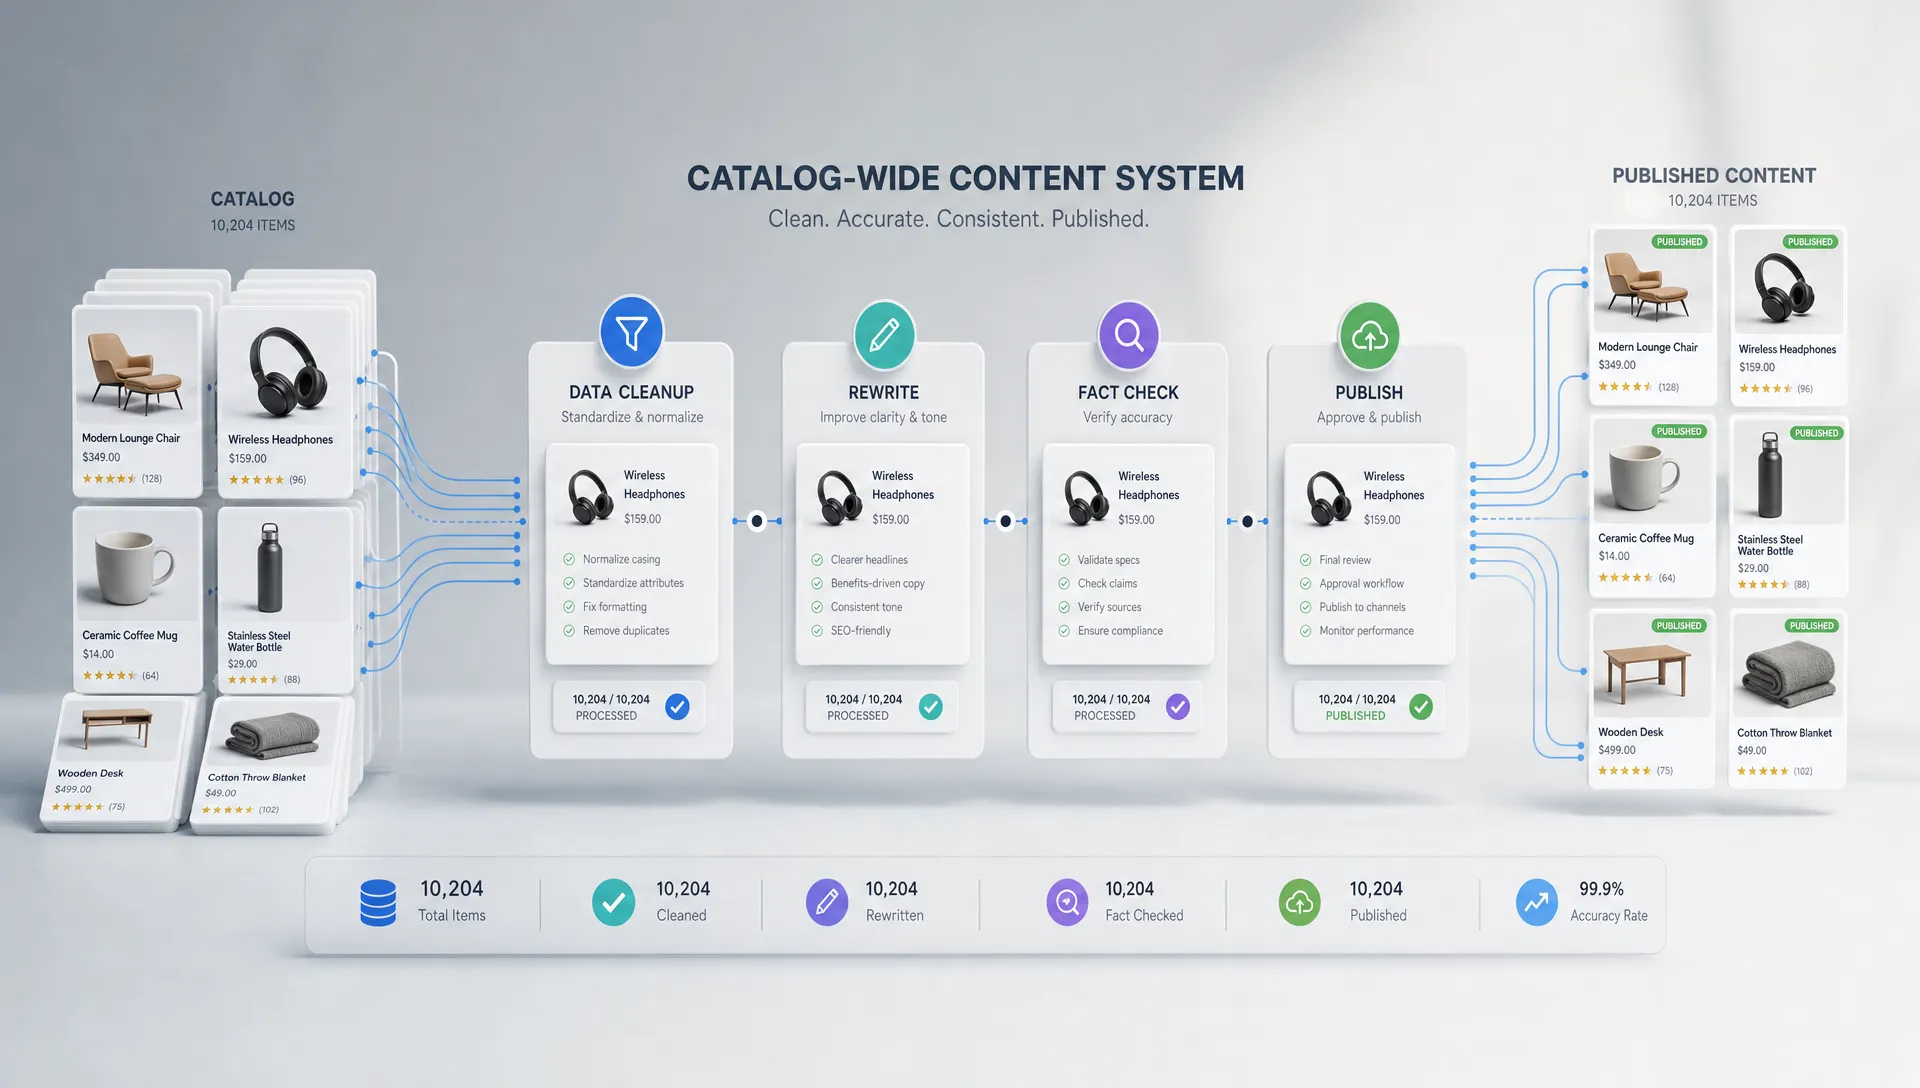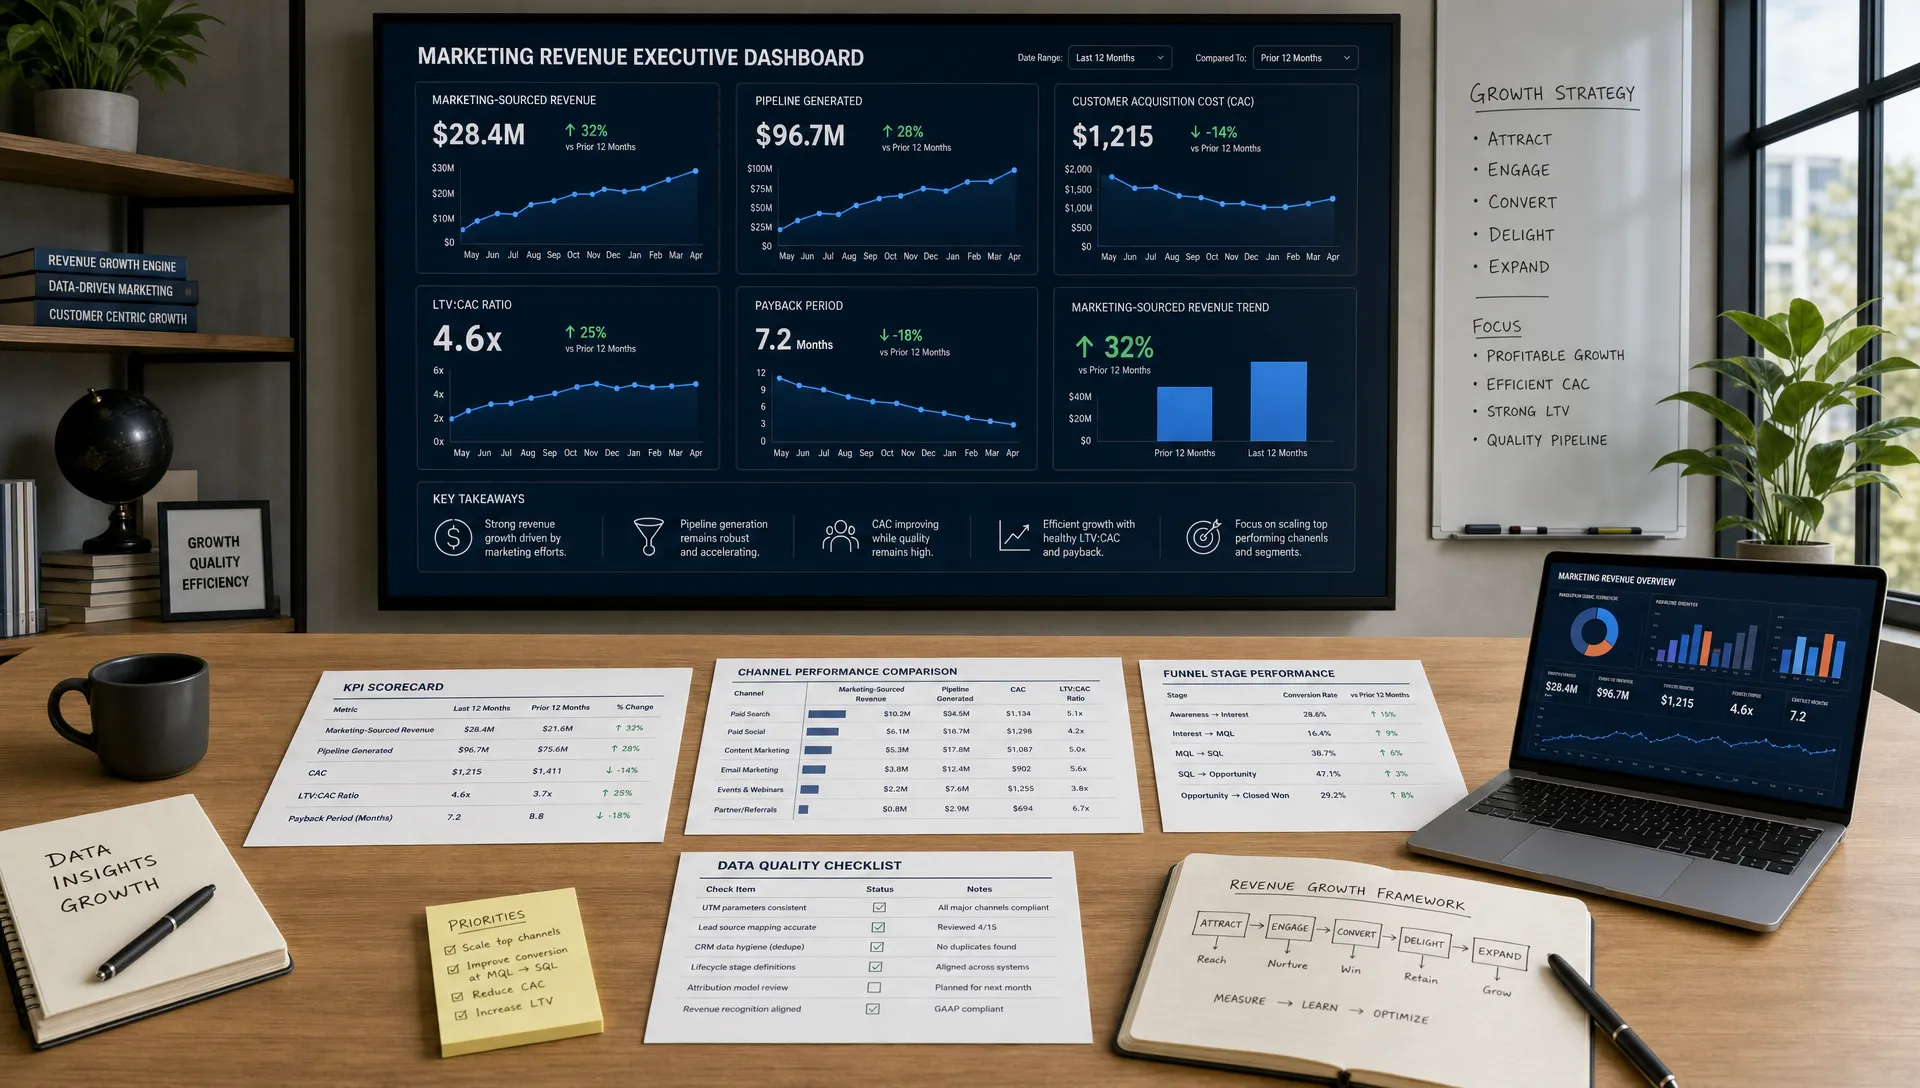
Marketing dashboards can either sharpen decision-making or bury teams in noise. The difference is not the number of charts, the tool you use, or how polished the design looks. The difference is whether your dashboard answers the questions that actually drive growth.
For most businesses, those questions are practical: Are we acquiring customers profitably? Which channels create qualified demand? Where does the funnel leak? Are campaigns improving revenue, retention, or pipeline quality? A strong dashboard helps marketers, founders, and revenue teams see those answers quickly, then act before performance drifts.
The best marketing dashboard metrics are not vanity numbers. They connect marketing activity to business outcomes, reveal trends over time, and help teams decide what to do next.
A metric matters when it changes a decision.
Pageviews, impressions, and social likes can be useful in context, but they rarely deserve top billing unless they are tied to a clear business goal. A dashboard built around surface-level activity often creates a false sense of progress. A dashboard built around outcomes shows whether marketing is helping the business grow efficiently.
Before choosing metrics, define three things:
A CEO does not need the same dashboard as a paid media specialist. A content team does not need the same dashboard as a sales development manager. The goal is not to track everything in one place. The goal is to make the right information visible to the right people at the right time.
Executive dashboards should be simple, outcome-focused, and tied to the economics of growth. These metrics help leadership understand whether marketing is producing sustainable results.
Marketing-sourced revenue measures revenue from customers whose first known touchpoint came from marketing. This metric is especially useful for teams that run inbound, paid acquisition, SEO, events, or content campaigns.
It answers a critical question: How much closed revenue did marketing directly originate?
The key is consistency. Define what counts as a marketing-sourced lead, align that definition with sales, and avoid changing attribution rules every month. Otherwise, the metric becomes a debate instead of a decision-making tool.
Not all marketing impact happens at the first touch. A prospect might discover your brand through organic search, join a webinar months later, talk to sales, and finally convert after reading a comparison page.
Marketing-influenced pipeline captures opportunities where marketing played a meaningful role somewhere in the journey. This is especially important for B2B, SaaS, finance, legal, and high-consideration buying cycles where multiple touchpoints influence the final decision.
A helpful dashboard separates sourced revenue from influenced pipeline. That distinction prevents overclaiming while still showing how marketing supports the full customer journey.
Customer acquisition cost, or CAC, shows how much you spend to acquire a new customer. A basic formula is:
CAC = total sales and marketing cost divided by new customers acquired
Some teams calculate paid CAC by channel, while others calculate blended CAC across all marketing and sales efforts. Both can be useful. Paid CAC helps optimize campaigns. Blended CAC helps leadership understand overall acquisition efficiency.
If CAC rises while conversion rates fall, you may have a targeting, messaging, pricing, or funnel quality problem. If CAC rises while average deal size also rises, the business may still be moving in the right direction.
The LTV:CAC ratio compares the value of a customer over time with the cost of acquiring that customer. It is one of the clearest ways to evaluate whether your growth model is healthy.
A ratio that is too low signals inefficient acquisition. A ratio that is extremely high may suggest underinvestment in growth, although this depends heavily on margins, cash flow, and business model.
This metric is most useful when it is segmented. Compare LTV:CAC by channel, customer segment, geography, product line, or campaign type. A single blended number can hide profitable pockets and costly mistakes.
Payback period measures how long it takes to recover acquisition costs from customer revenue or gross profit. For subscription and recurring revenue businesses, this metric is often more actionable than CAC alone.
If your payback period is getting longer, growth may become harder to finance even if total revenue is increasing. If payback improves, you may have room to scale campaigns more confidently.
Acquisition metrics show whether your marketing efforts are bringing people into the funnel. The mistake many teams make is treating traffic as the goal. Traffic only matters if it creates qualified engagement, pipeline, revenue, or strategic reach.
Instead of showing only total sessions, track qualified traffic by channel. Qualification can be based on engagement, source, visitor fit, conversion intent, or account quality.
For example, a SaaS company may care less about total blog visits and more about visits from target industries that reach pricing, demo, or integration pages. A legal or finance business may prioritize visitors from specific locations, service needs, or high-intent search terms.
Channel views should include organic search, paid search, paid social, email, referral, direct, partner traffic, and campaign-specific sources. If you operate across several platforms, align your dashboard with your broader multi-channel brand strategy so performance is not evaluated in disconnected silos.
CPC and CPM are diagnostic metrics. They help you understand media cost, competition, and campaign efficiency, but they do not prove business value on their own.
A low CPC can still be wasteful if traffic does not convert. A high CPC can be acceptable if it brings high-value prospects. Always evaluate these metrics alongside conversion rate, cost per lead, cost per opportunity, and revenue.
Click-through rate, or CTR, measures how often people click after seeing an ad, search result, email, or call to action. It is useful for diagnosing message relevance.
A weak CTR can indicate poor targeting, unclear creative, uncompetitive positioning, or a mismatch between audience intent and offer. A strong CTR is not automatically a win, though. If clicks are high and conversions are low, your promise may be attracting curiosity rather than qualified demand.
This metric helps you understand whether your marketing is expanding reach or deepening existing interest. New visitors indicate audience growth. Returning visitors often suggest consideration, research, and trust-building.
For longer buying cycles, returning visitor behavior can be particularly valuable. Prospects may come back multiple times before converting, especially when evaluating complex services, software, financial products, or legal solutions.
Conversion metrics reveal whether your audience is taking meaningful steps. These are often the most important metrics for campaign managers because they connect traffic and engagement to business outcomes.
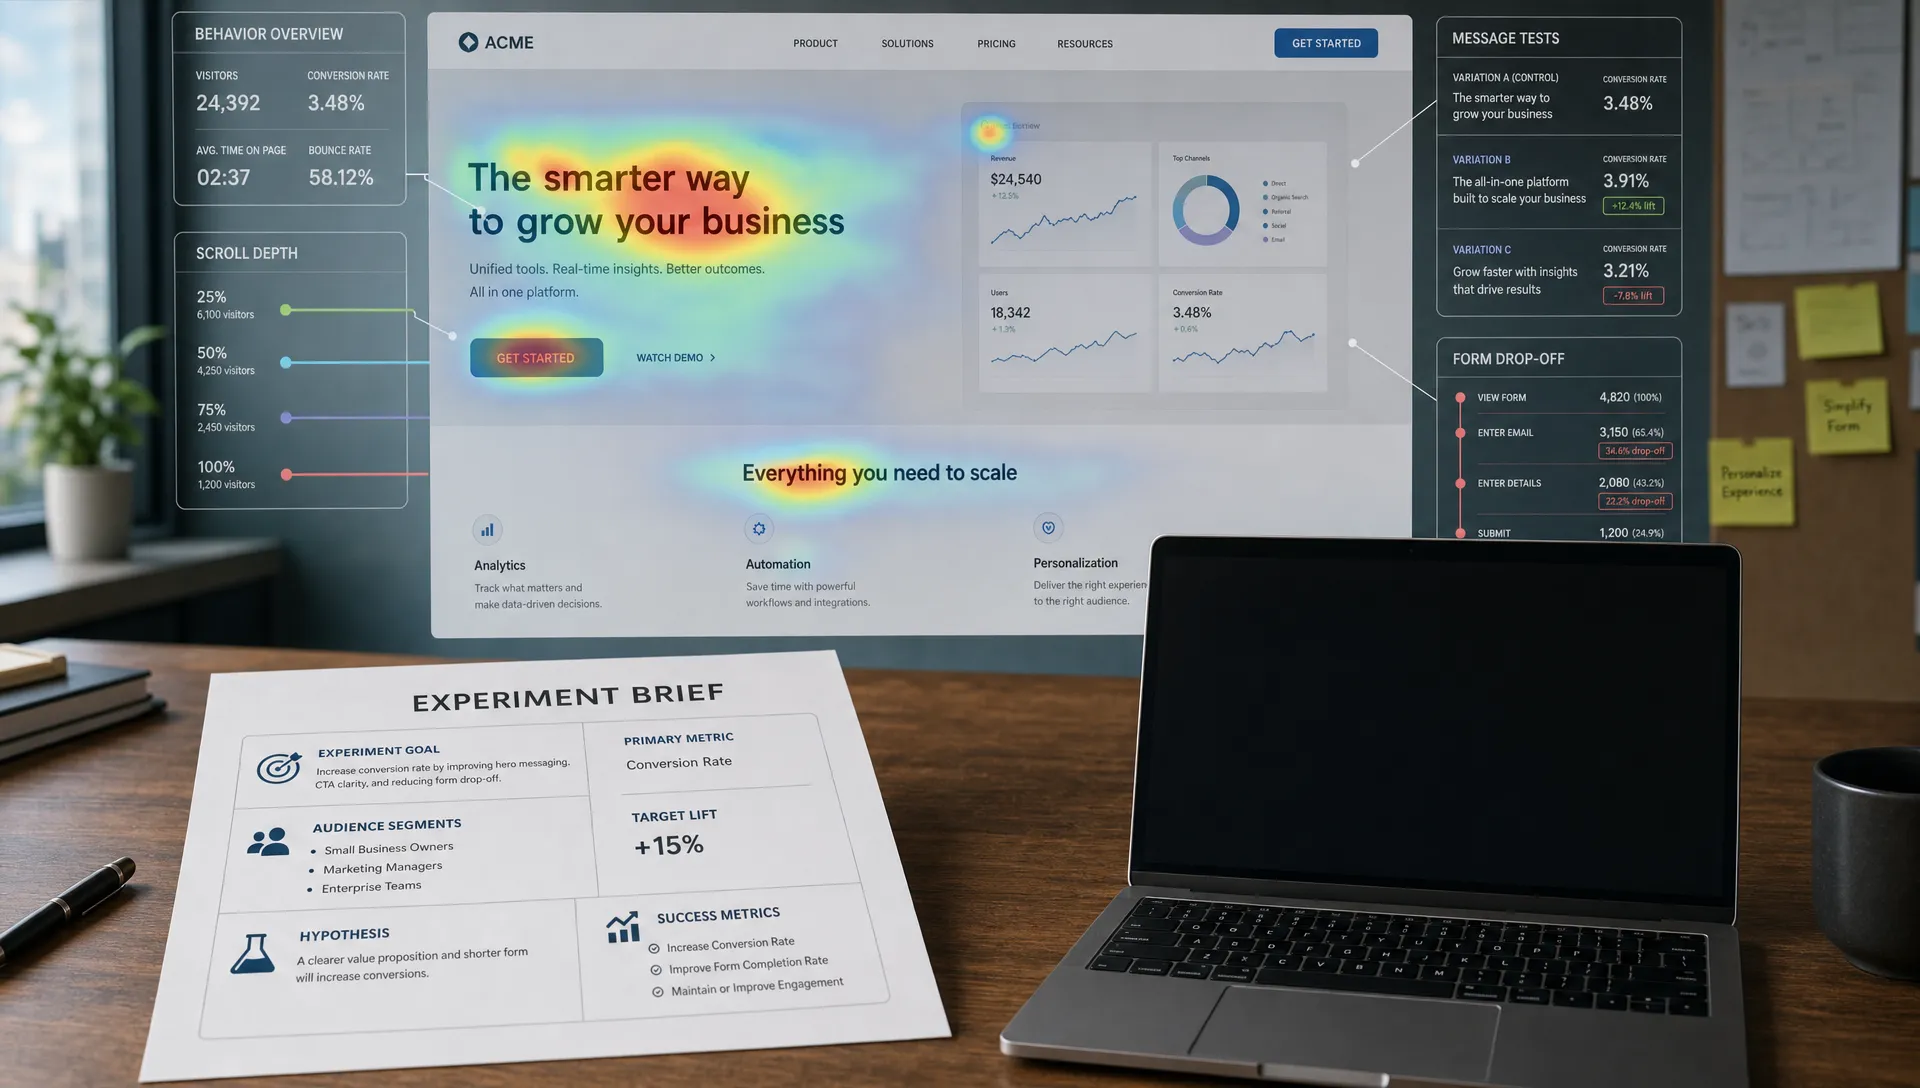
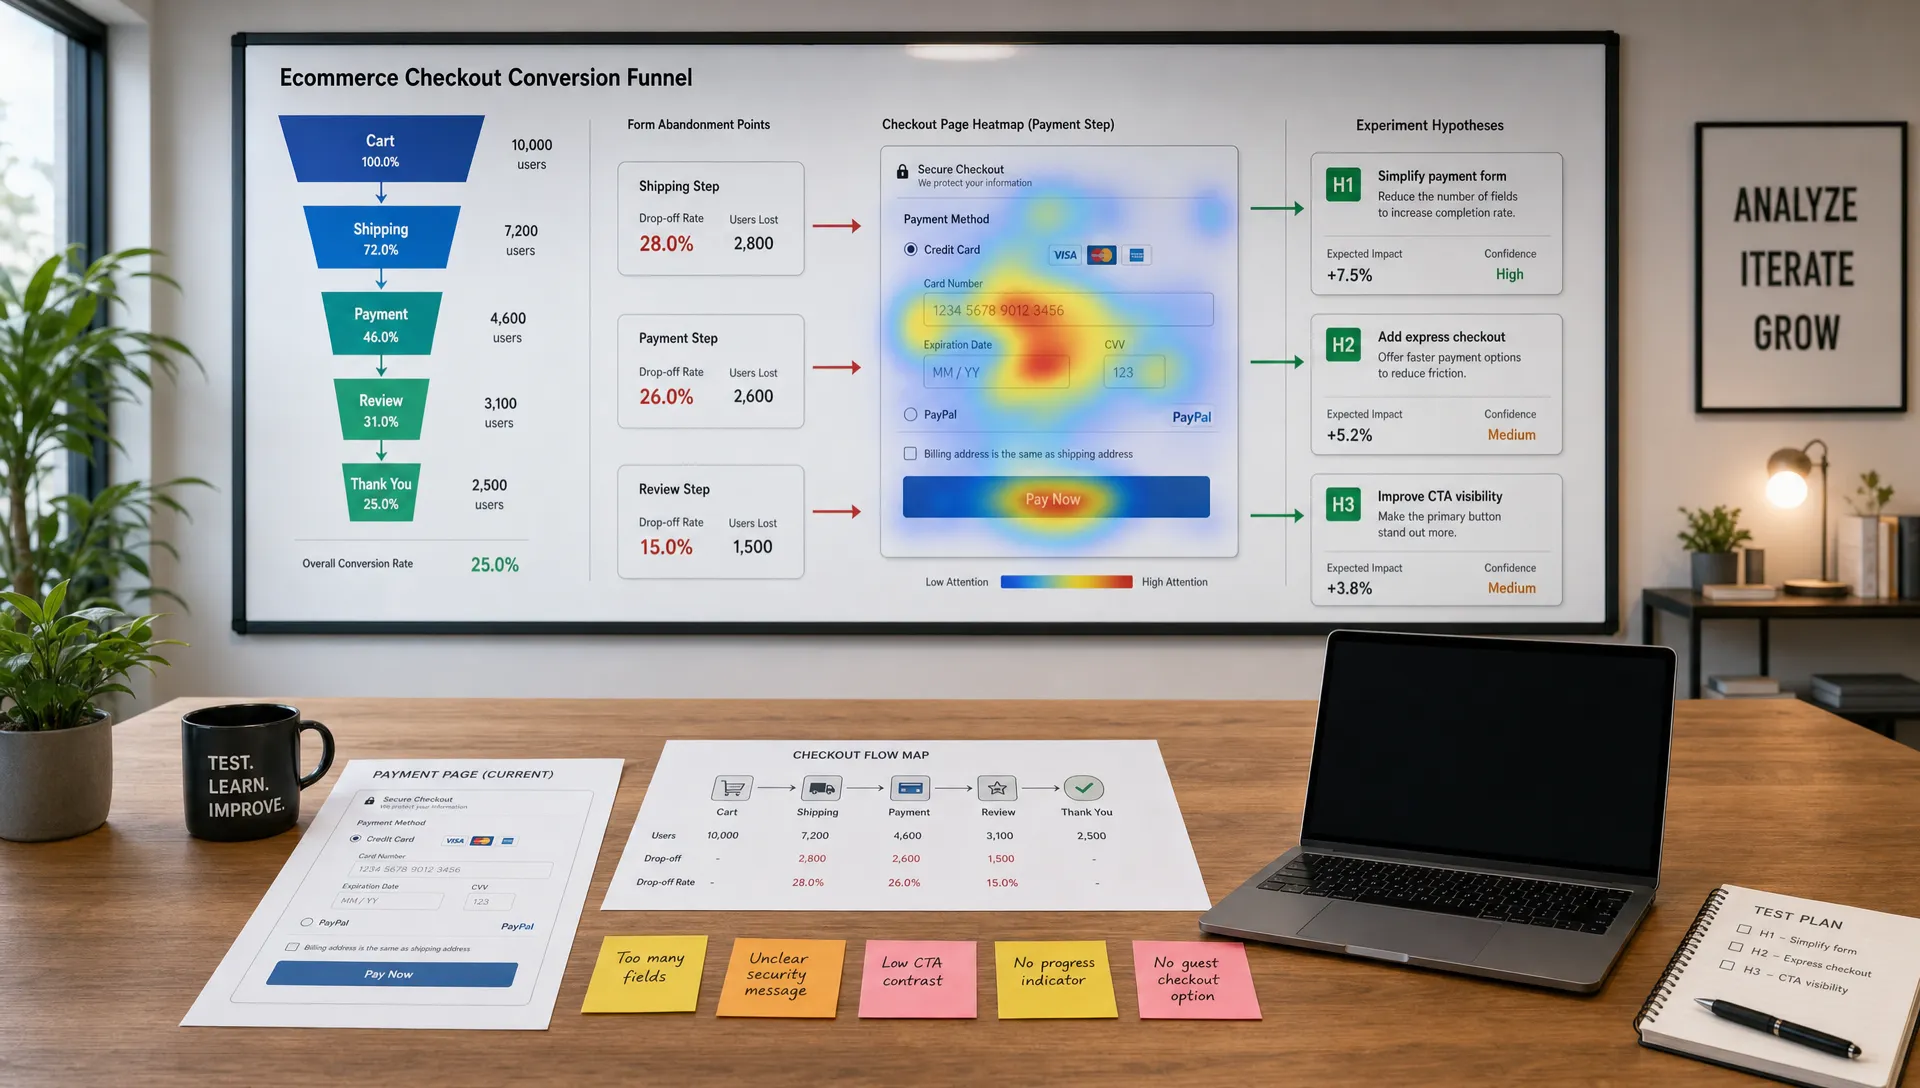
Conversion rate measures the percentage of visitors or users who complete a desired action. That action might be submitting a form, booking a demo, downloading a guide, starting a trial, subscribing, requesting a quote, or making a purchase.
A useful dashboard should show conversion rate by source, landing page, campaign, device, audience segment, and offer type. This makes it easier to identify what is actually working.
Google Analytics 4 uses key events to measure important user actions, and Google’s documentation on conversion and key event measurement is a useful reference for teams standardizing tracking.
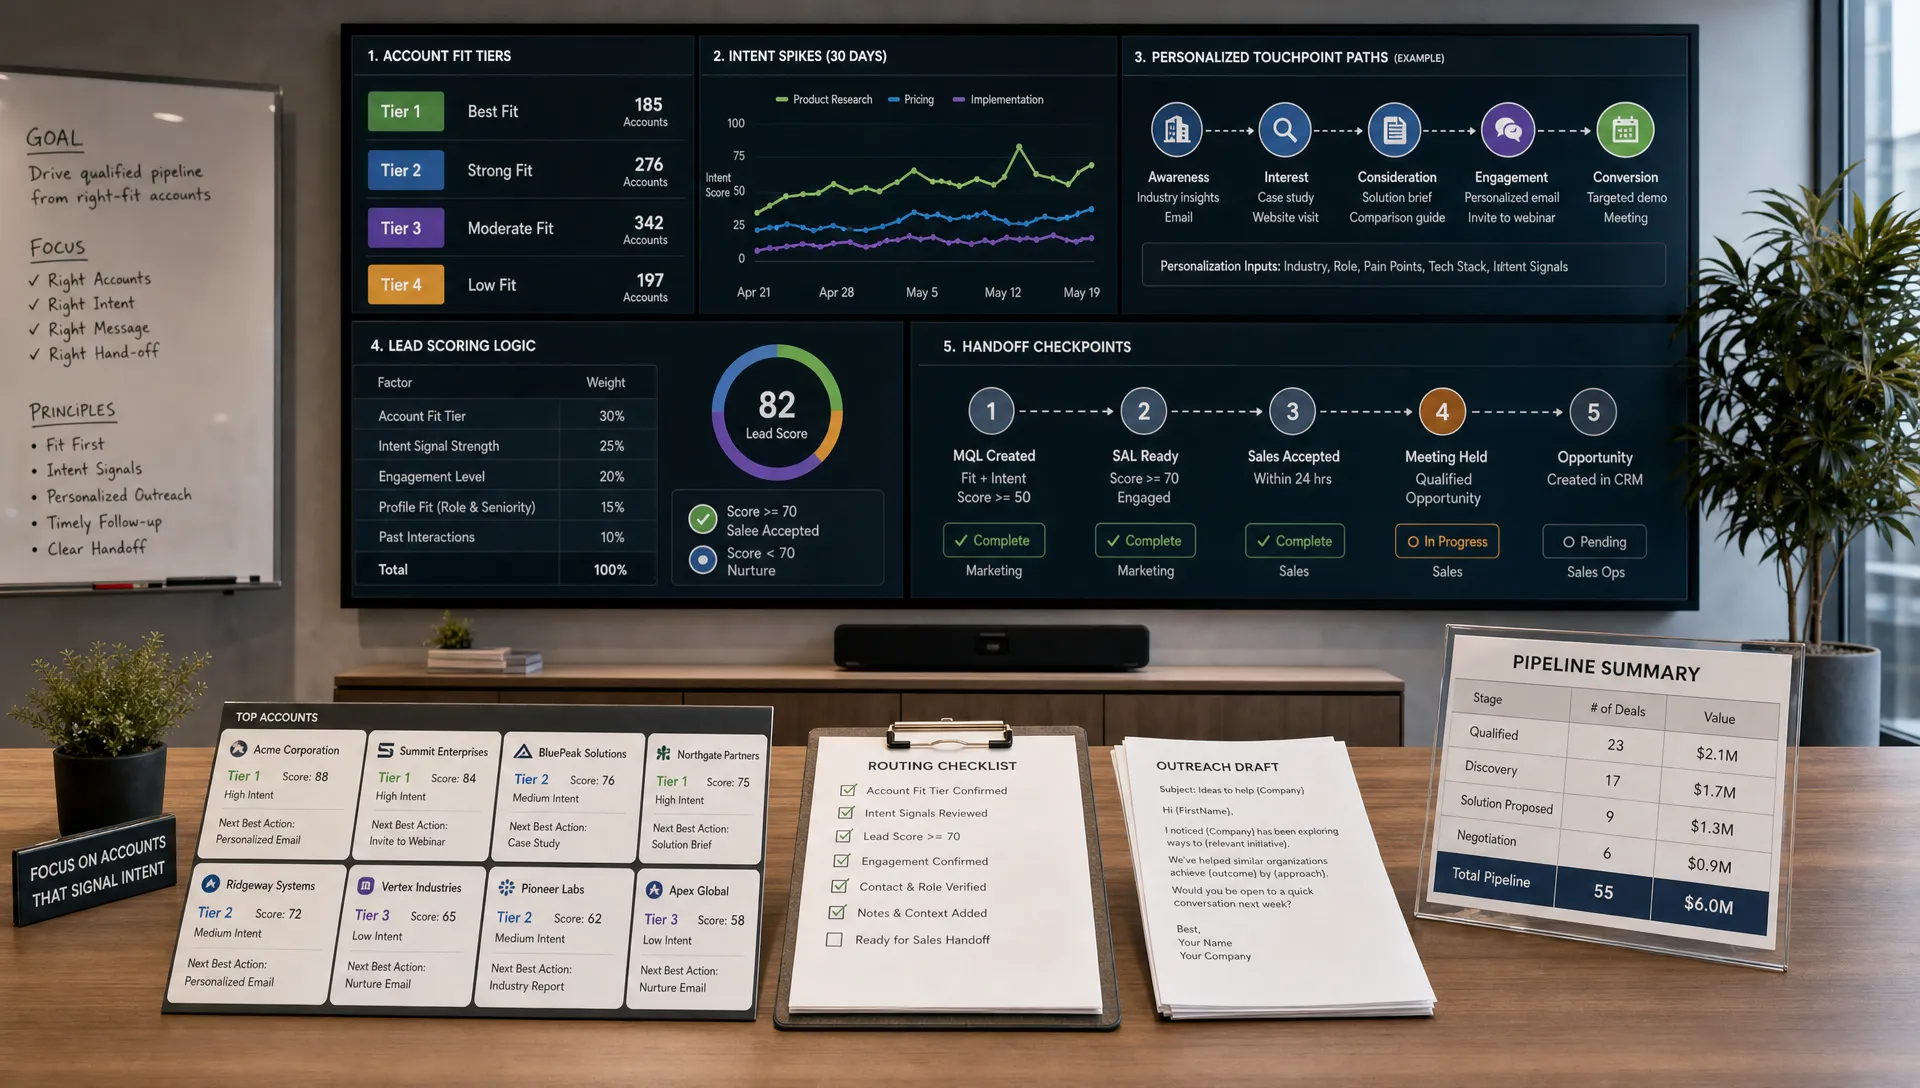
For B2B and service-based businesses, not every lead has equal value. Lead-to-MQL rate shows how many leads meet your marketing qualification criteria. MQL-to-SQL rate shows how many of those leads are accepted or qualified by sales.
These metrics expose alignment problems. If lead volume is high but MQL rate is low, marketing may be attracting the wrong audience. If MQL rate is strong but SQL rate is weak, your scoring criteria may not match what sales considers qualified.
Cost per lead can be misleading if tracked alone. A campaign that generates cheap leads may still lose money if those leads are unqualified. Cost per qualified lead gives a more accurate view of performance.
The best dashboards show both numbers. When the gap between CPL and cost per qualified lead grows, it is a signal to review targeting, forms, offers, and lead scoring.
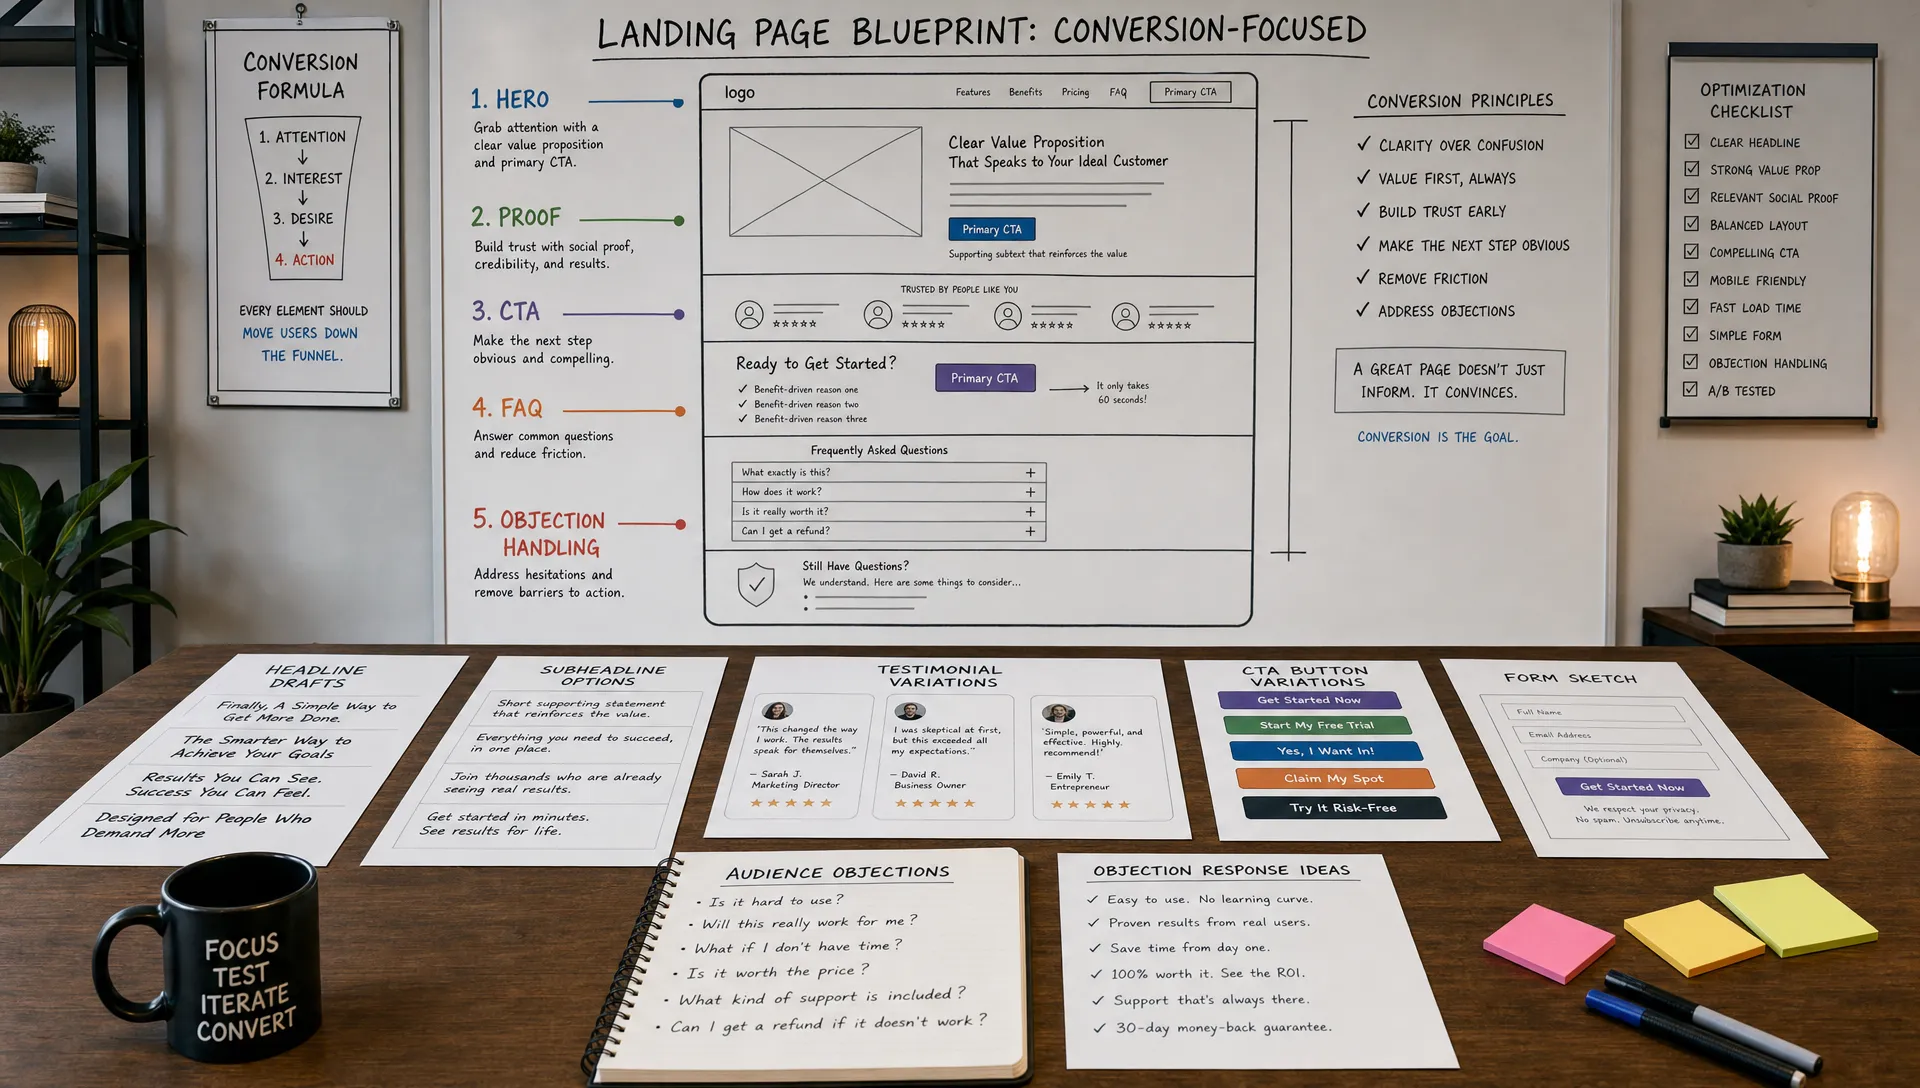
Landing pages are often where marketing performance is won or lost. Track conversion rate by page and traffic source, not just overall site conversion.
A landing page with high paid search conversion may perform poorly with social traffic because the intent is different. A page that converts desktop visitors may struggle on mobile due to form length, load speed, or layout. Segmenting landing page performance prevents broad averages from hiding specific opportunities.

Marketing dashboards become more valuable when they do not stop at the lead. The handoff between marketing and sales is where many funnels leak.
Speed to lead measures how quickly your team follows up after a prospect takes a high-intent action. For many businesses, fast response times improve the chance of meaningful conversation, especially for demo requests, quote requests, and consultation forms.
If speed to lead is slow, the problem may not be campaign quality. It may be routing, notifications, staffing, CRM setup, or unclear ownership.
Opportunity creation rate shows how many qualified leads become sales opportunities. This metric is a strong indicator of lead quality and sales readiness.
If opportunities are not being created, look at message match, lead source, sales notes, call outcomes, and qualification criteria. Marketing and sales should review this metric together, not separately.
Pipeline velocity measures how quickly opportunities move through the sales process. A simplified way to think about it is the value of opportunities multiplied by win rate, divided by sales cycle length.
Marketing can influence pipeline velocity by improving education, objection handling, proof points, comparison content, and nurture sequences. This is where content, sales enablement, and lifecycle marketing become measurable contributors to revenue.
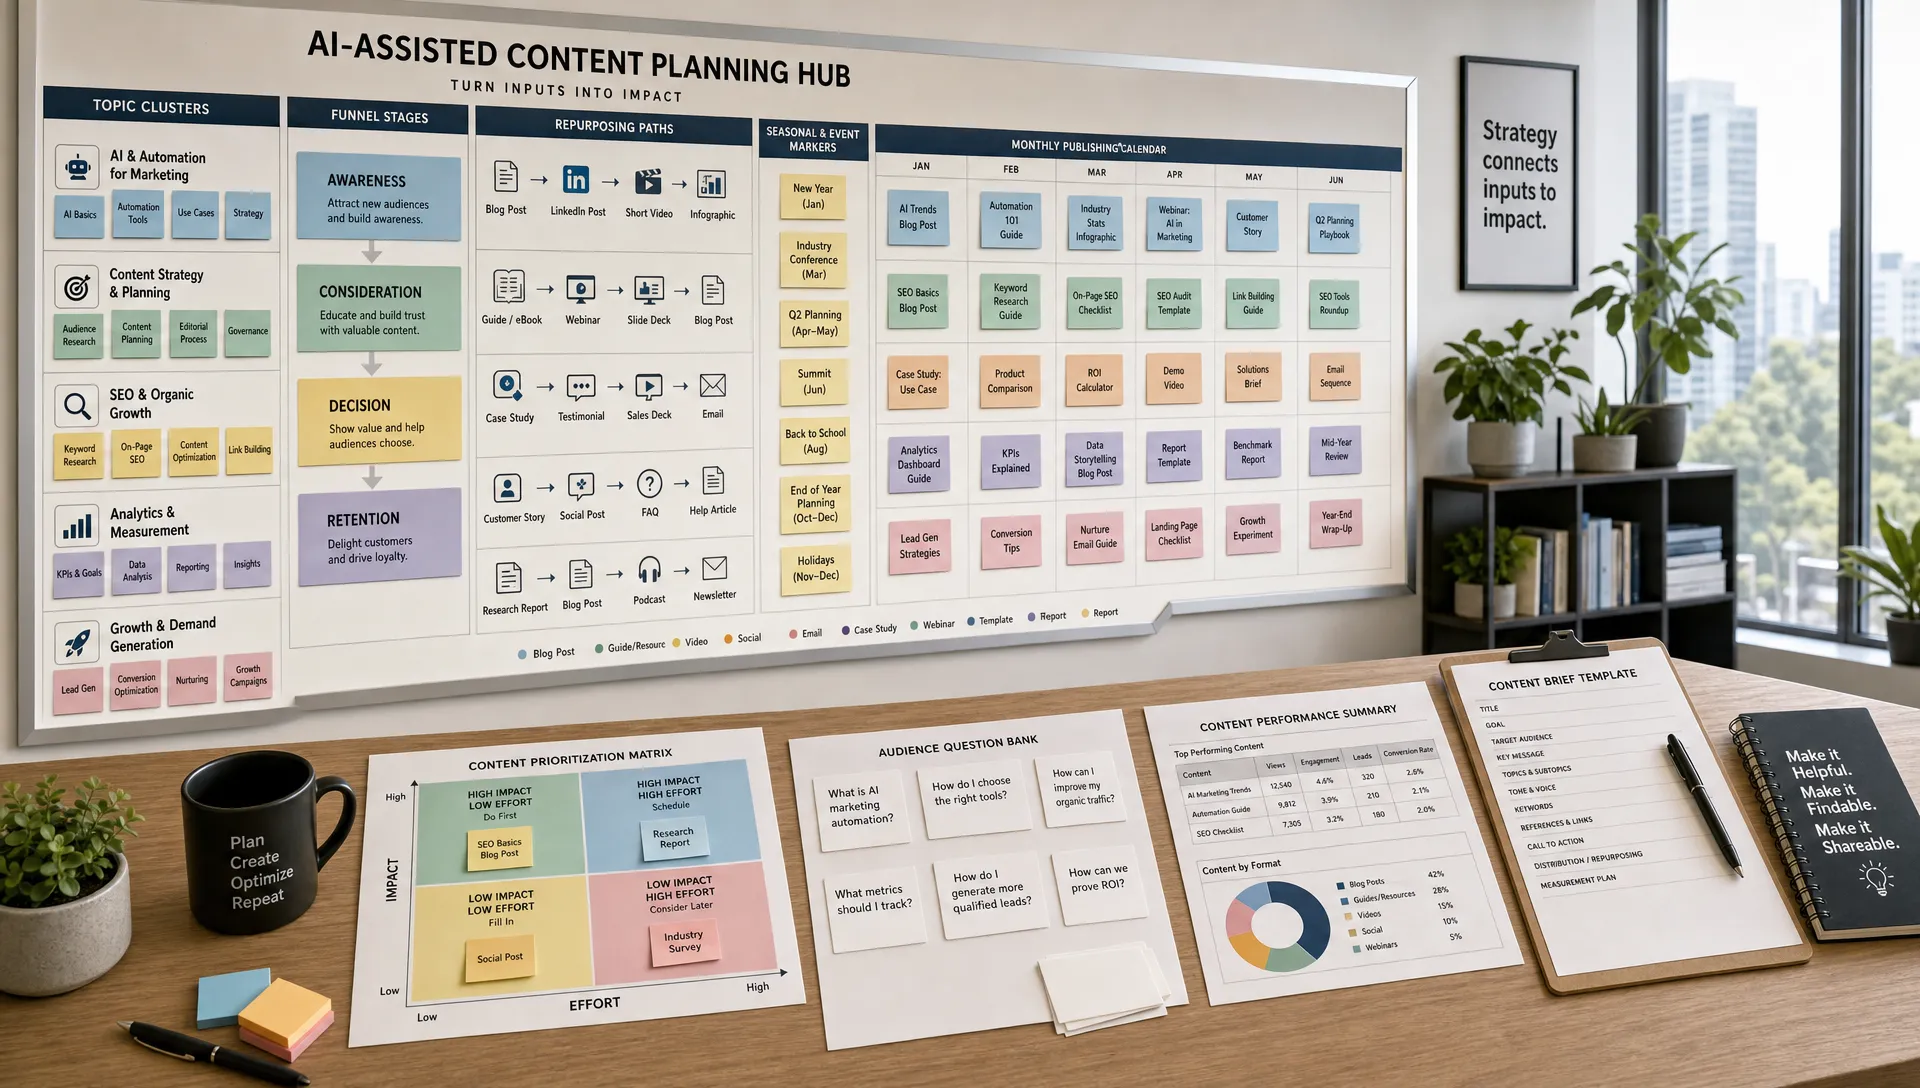
Content dashboards often overemphasize output. Publishing more is not the same as creating more value. Strong content metrics connect visibility, relevance, and conversion.
Branded search traffic is valuable, but it often reflects existing demand. Non-branded organic traffic shows whether your content is reaching people who may not already know your business.
Track non-branded traffic by topic cluster, search intent, and conversion path. This helps you see which content themes attract useful demand, not just large audiences.
Organic conversions show whether search traffic is producing business outcomes. Depending on your model, this may include demo requests, contact forms, signups, downloads, purchases, or assisted conversions.
A page with modest traffic but strong conversion intent can be more valuable than a high-traffic educational post with no next step. That is why content dashboards should include conversion metrics beside visibility metrics.
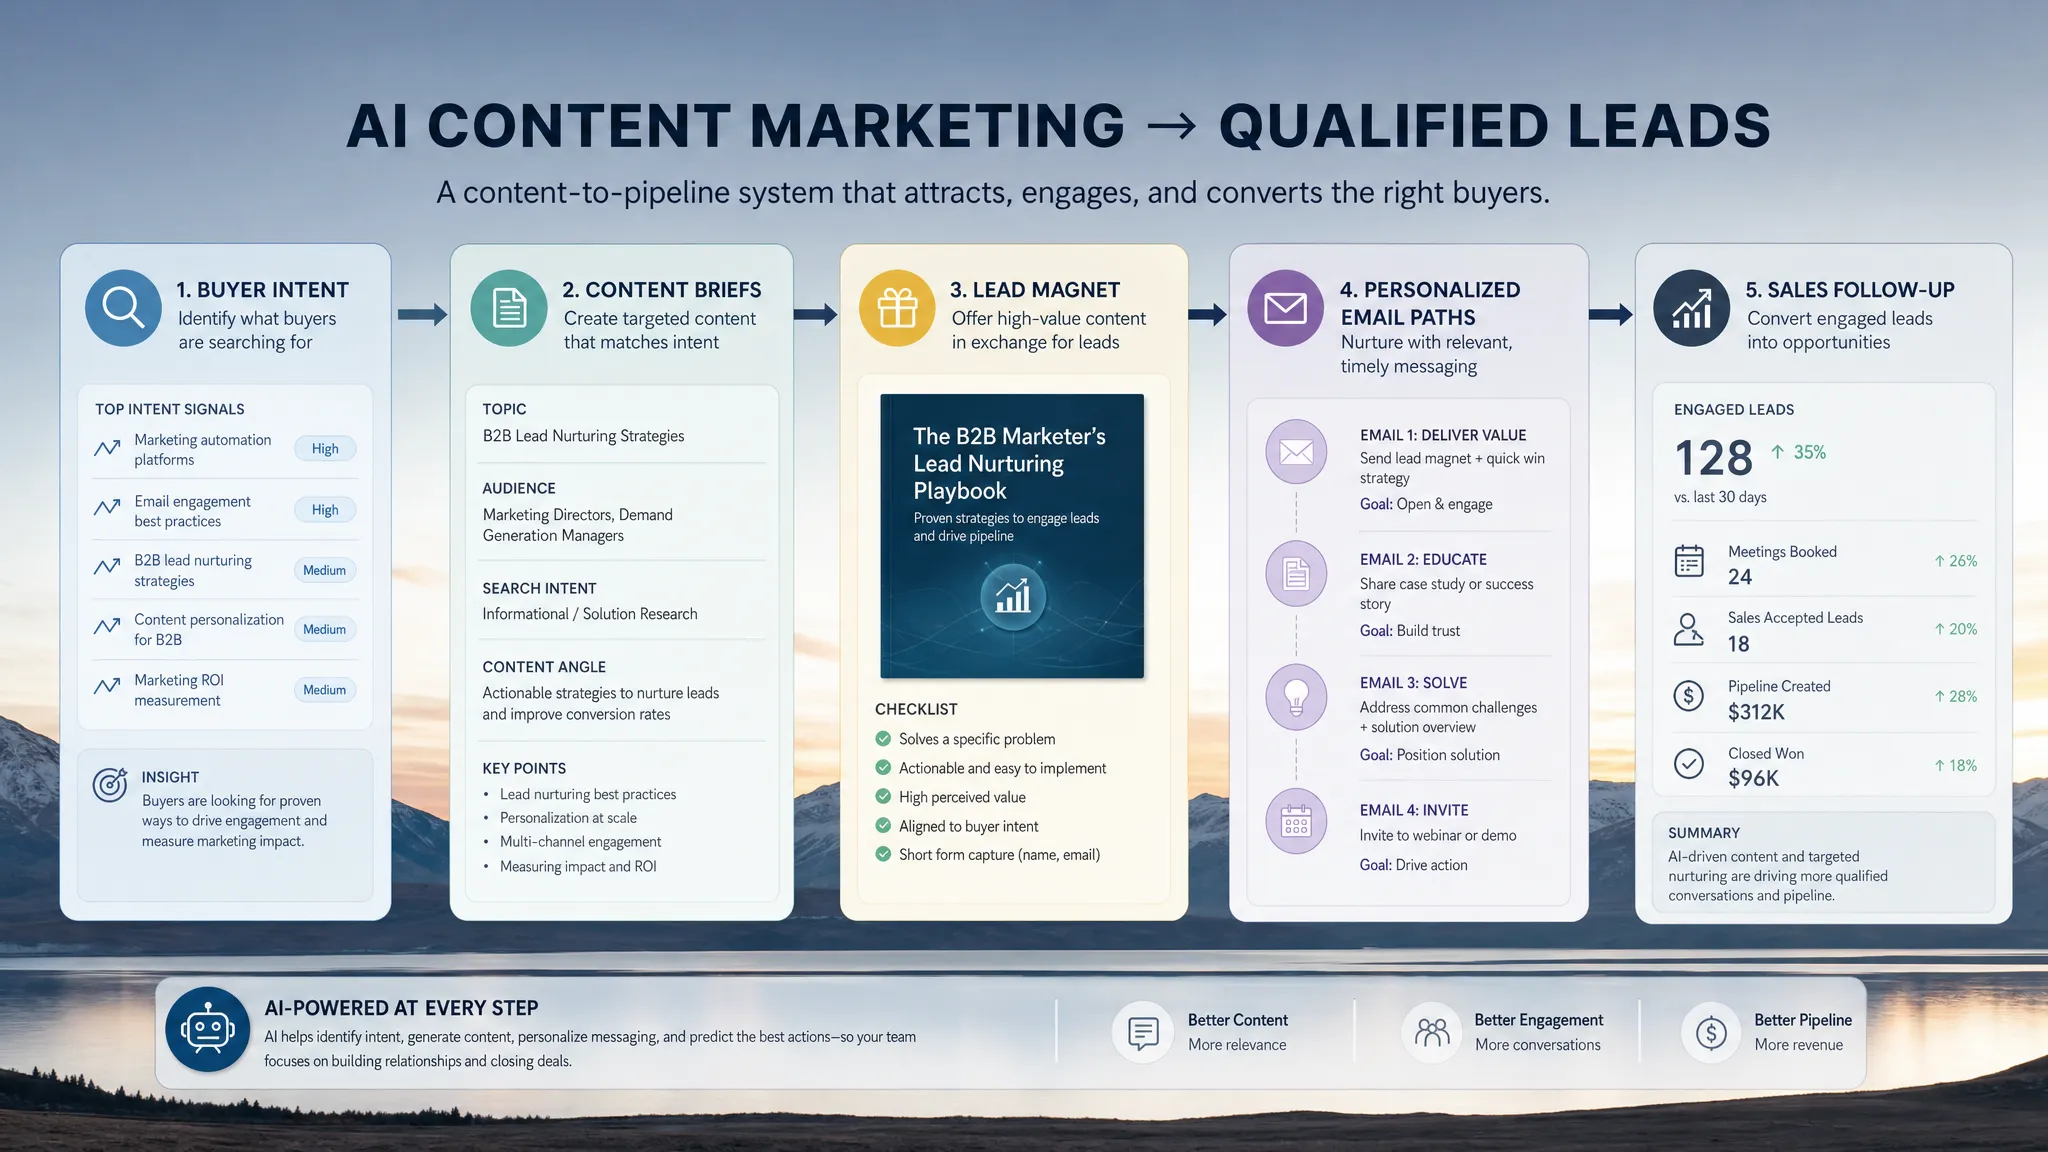
For longer sales cycles, content often assists rather than directly converts. A buyer might read several articles, compare options, then convert later through a branded search or sales referral.
Content assisted pipeline helps teams understand which guides, landing pages, case studies, and comparison assets contribute to deal progression. If you are using AI content generation to scale output, pair publishing volume with quality and revenue indicators. AIMarketer Hub’s guide to AI content generation tips for better ROI is a helpful complement when evaluating content performance beyond speed alone.
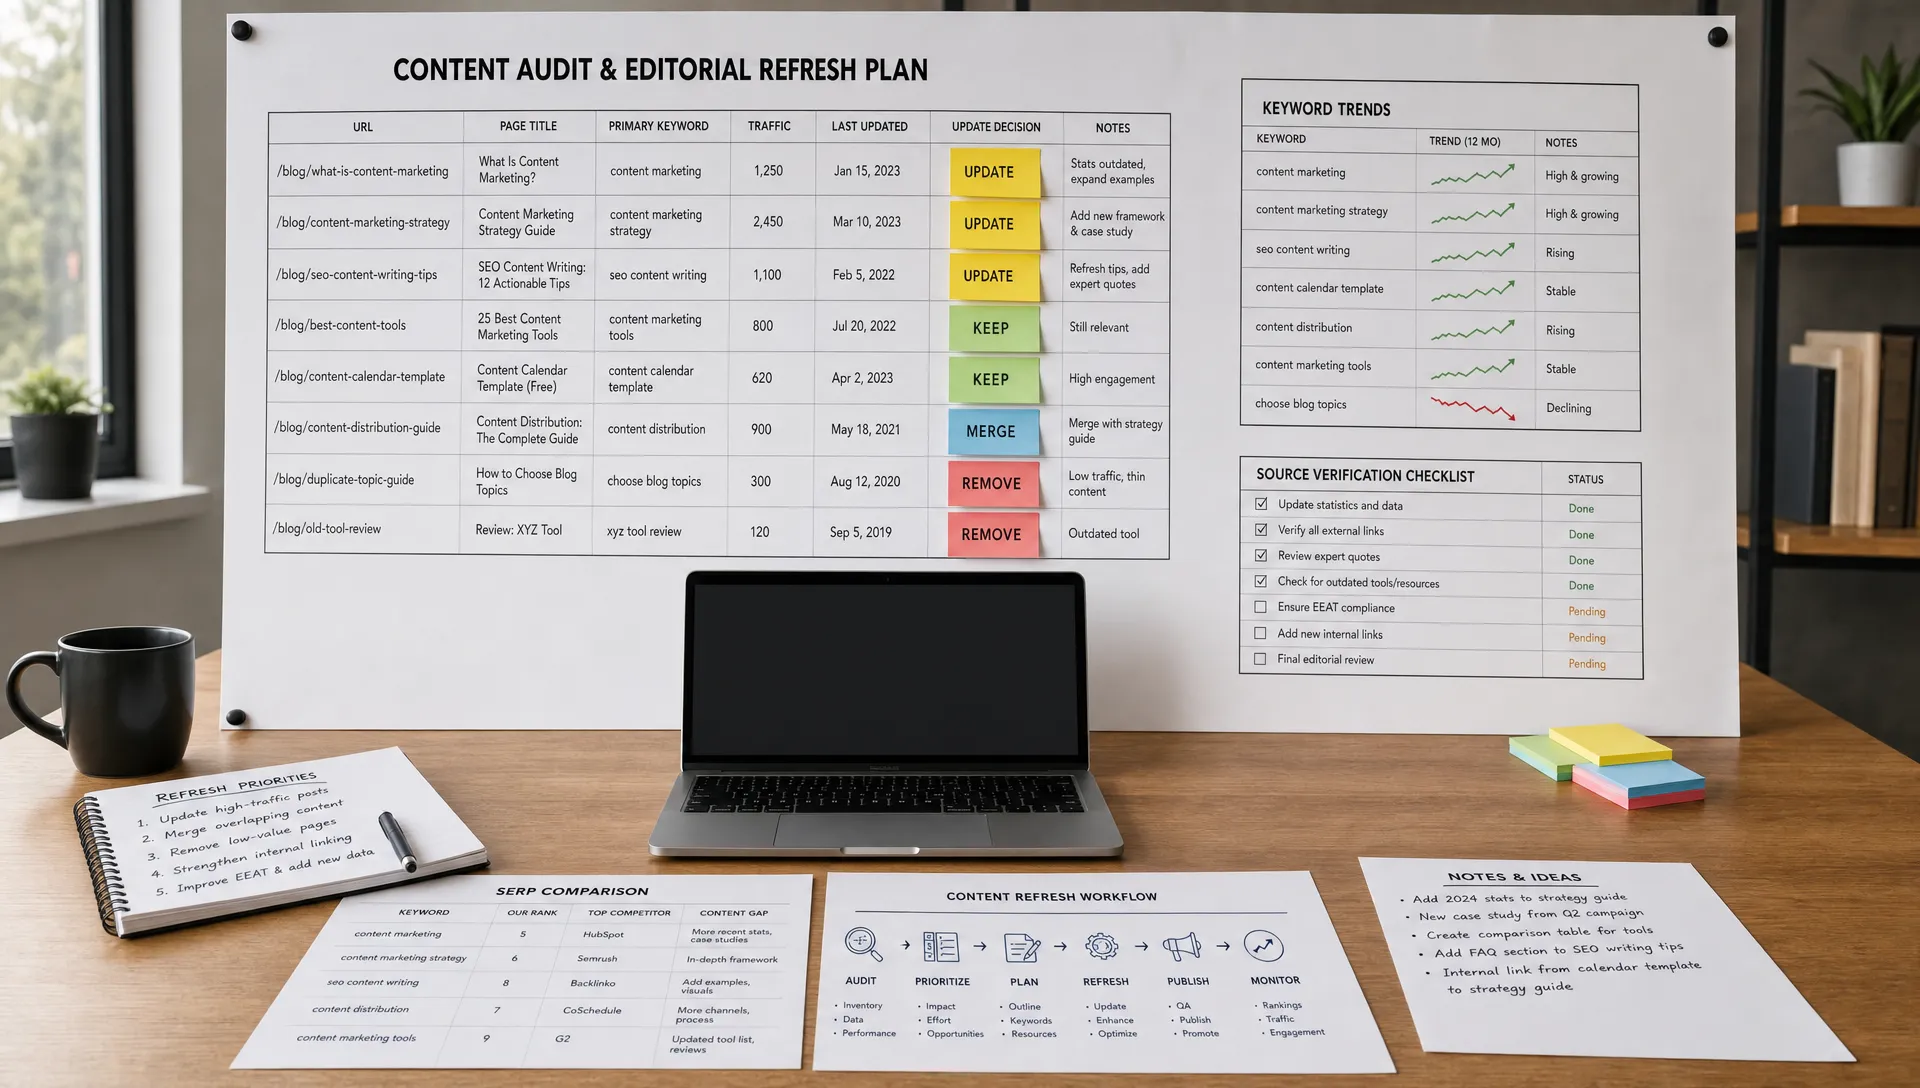
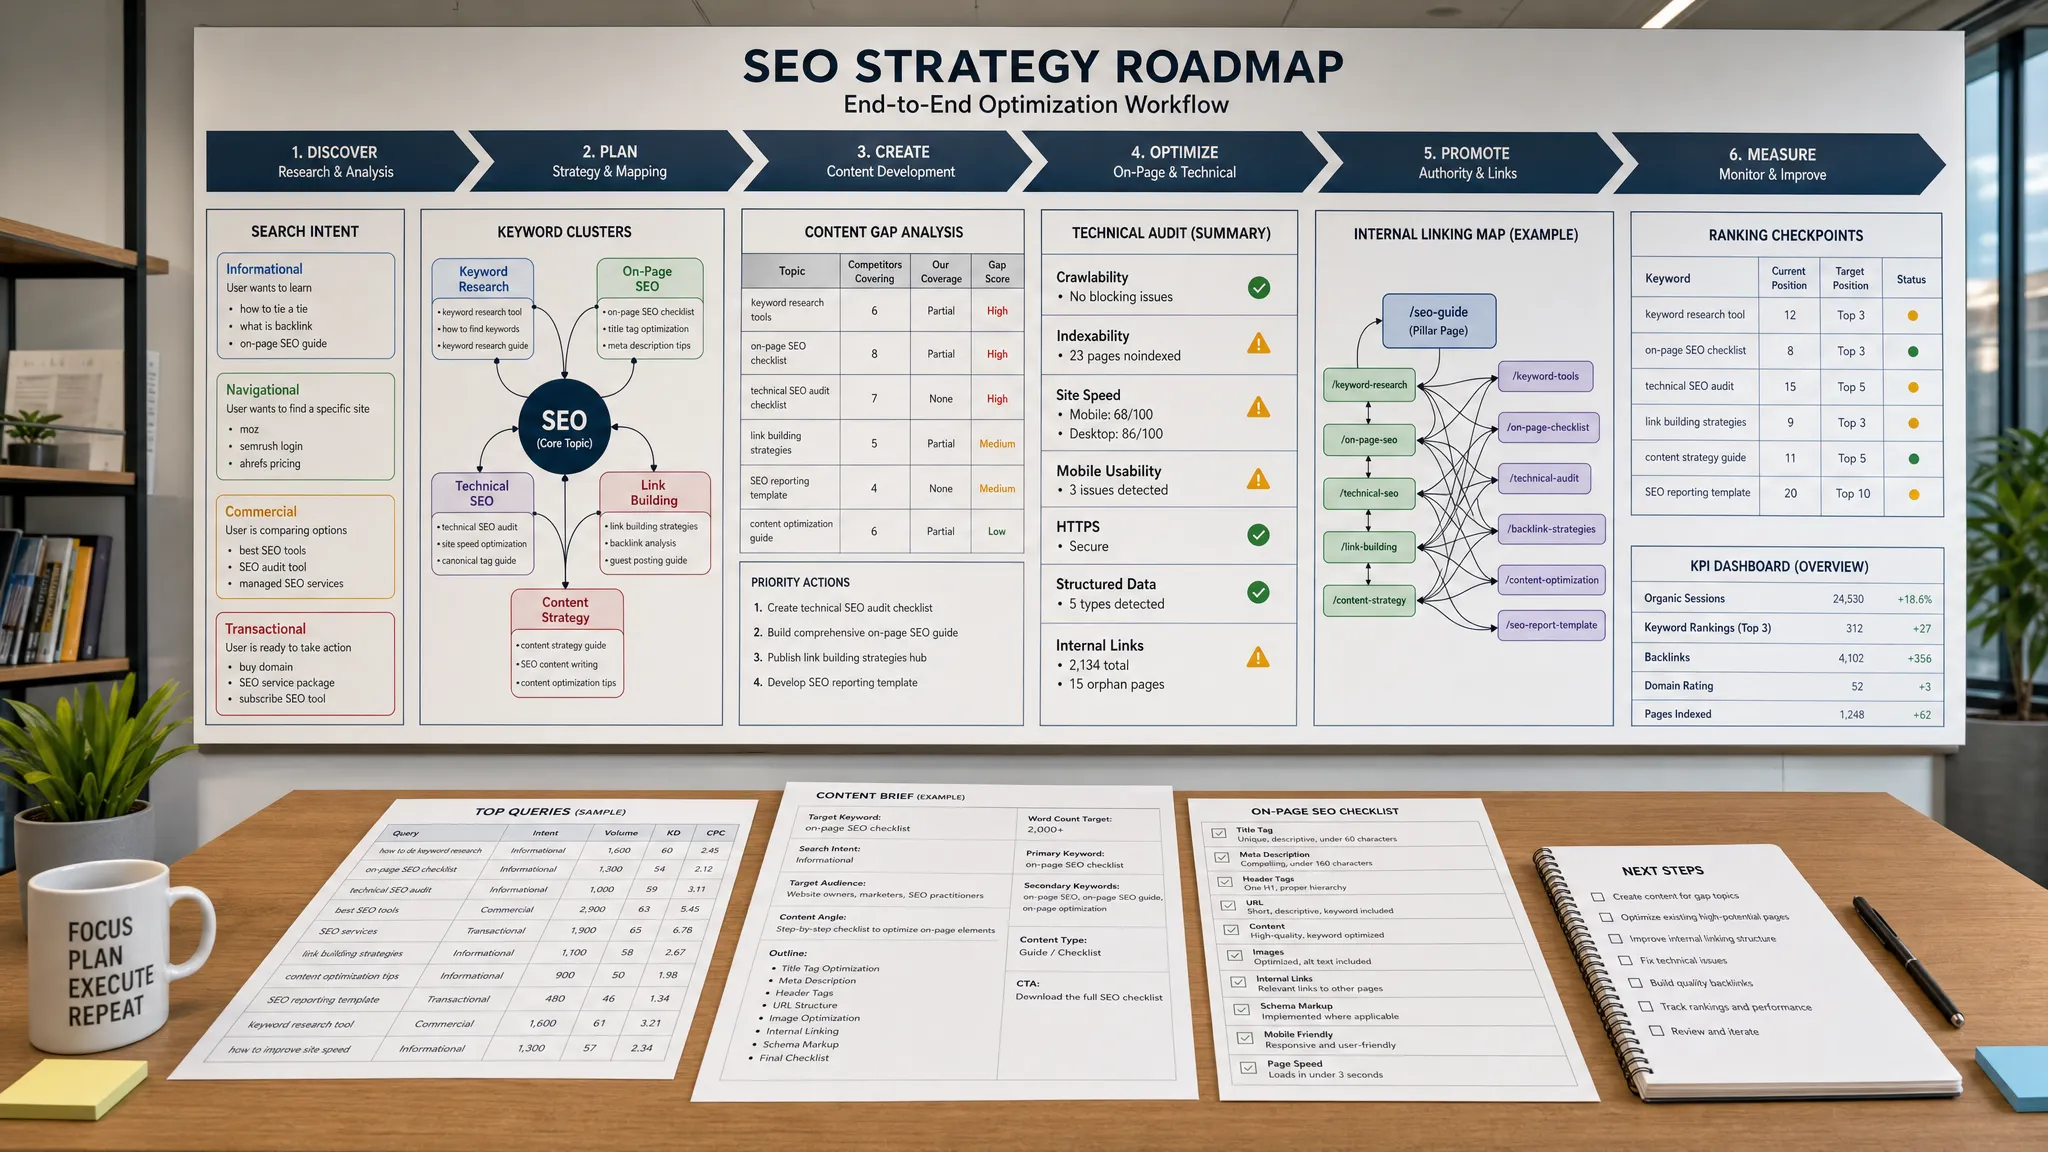
Content decay happens when older pages lose rankings, traffic, or conversions over time. A useful SEO dashboard flags declining pages and measures the impact of refreshes.
Track impressions, clicks, average position, conversions, and assisted revenue before and after updates. This keeps SEO work focused on compounding assets rather than endless new production.
Ad platforms provide plenty of metrics, but platform-reported performance should not be the only source of truth. Your dashboard should connect ad spend to CRM, ecommerce, or revenue data whenever possible.
ROAS measures revenue generated for every dollar spent on ads. It is useful, especially for ecommerce and direct-response campaigns, but it can be incomplete if it ignores margins, refunds, sales cycles, or offline conversions.
A campaign with strong ROAS may still be less profitable if it promotes low-margin products. A campaign with lower immediate ROAS may be valuable if it acquires customers with high retention or expansion potential.
Marketing efficiency ratio, sometimes called MER, compares total revenue with total marketing spend. Unlike platform-specific ROAS, it gives a broader view of marketing efficiency across channels.
MER is helpful because customers rarely convert after one isolated touchpoint. It allows leadership to see whether total marketing investment is producing total business growth, even as attribution becomes harder due to privacy changes and cross-device behavior.
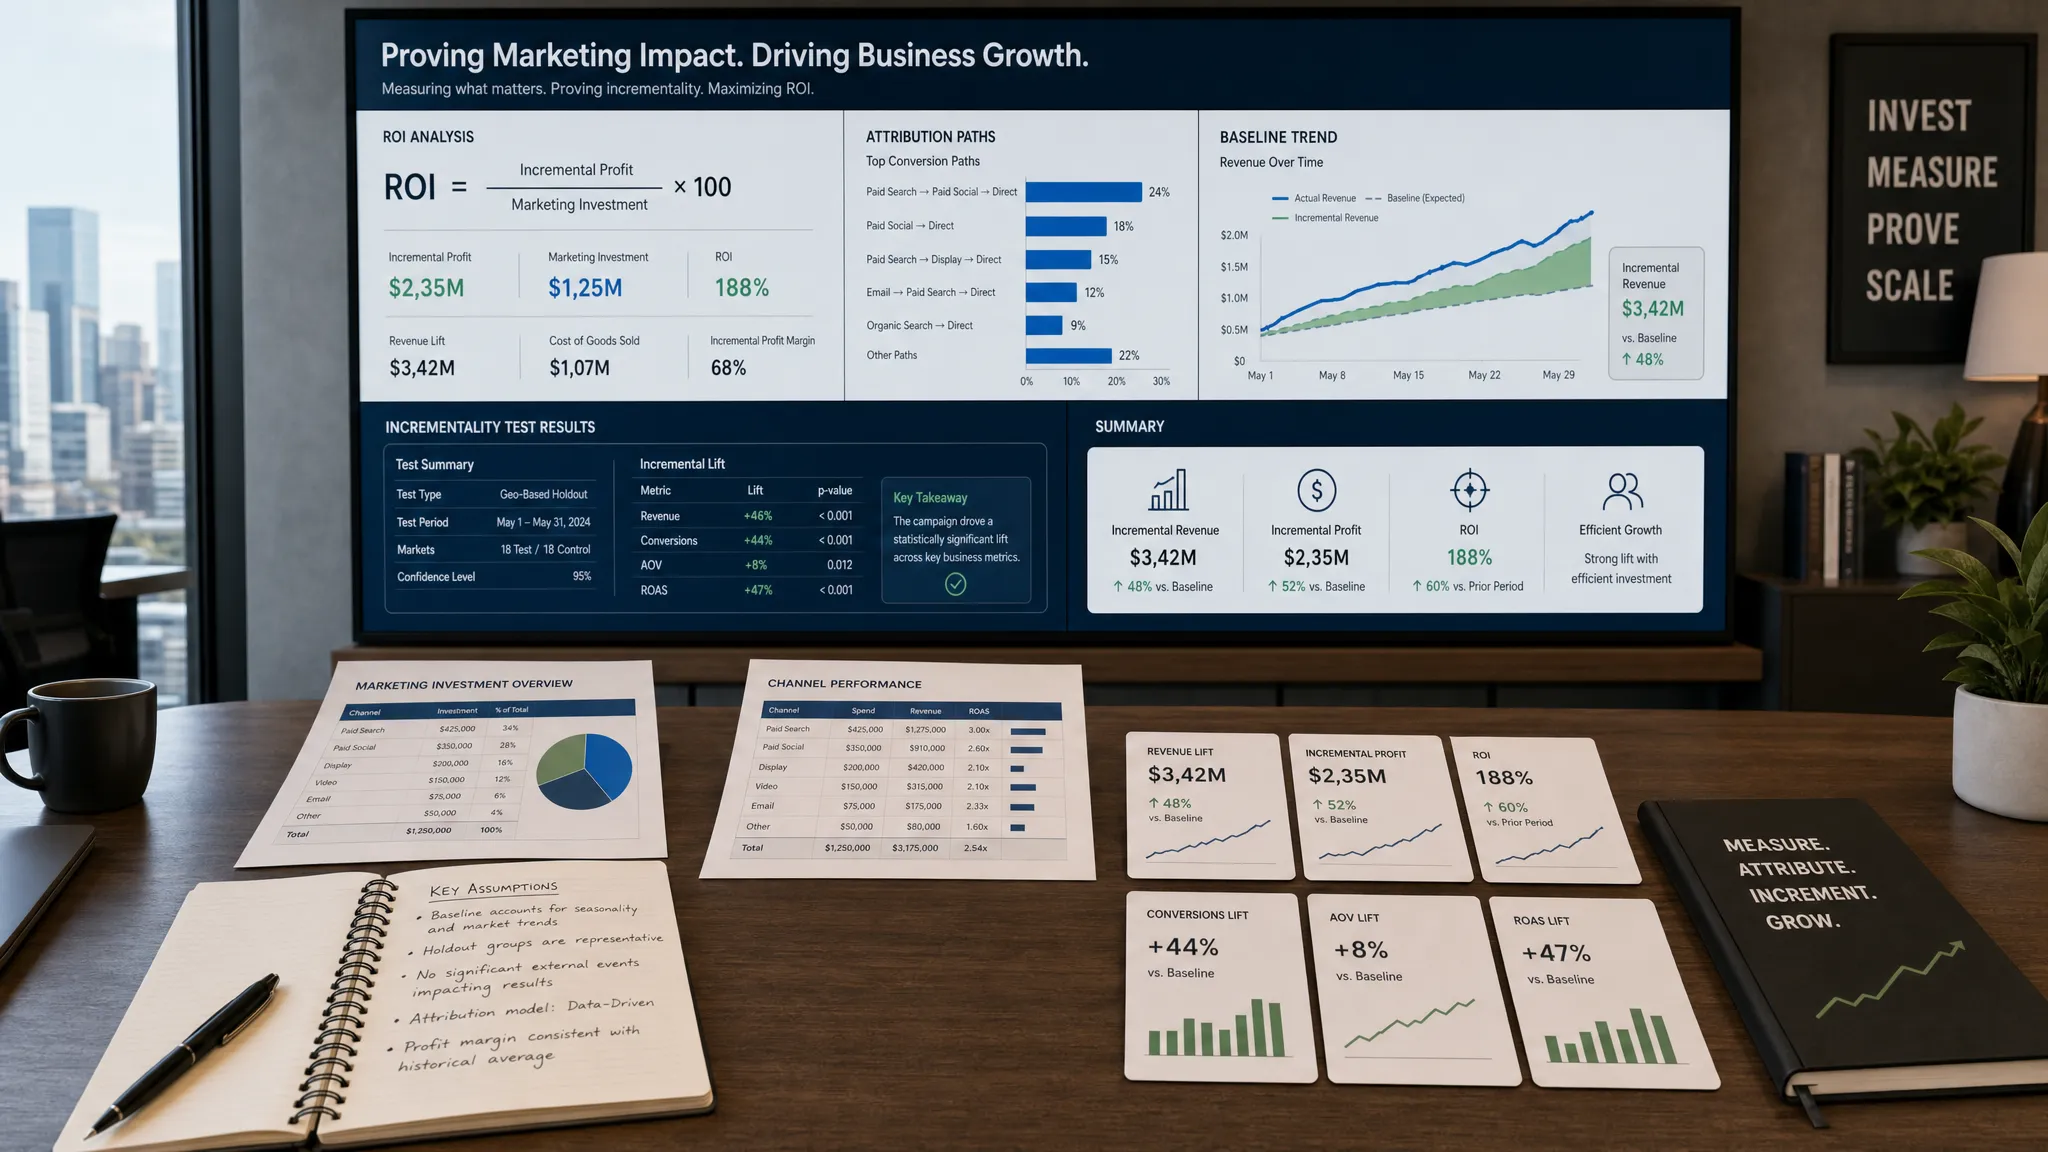
Incrementality asks a harder question: Did the campaign create results that would not have happened otherwise?
This matters because some campaigns capture demand that already existed. Brand search ads, retargeting, and bottom-funnel campaigns can look excellent in attribution reports while adding less net-new growth than expected.
Incrementality can be tested through holdout groups, geo tests, audience exclusions, or controlled experiments. Even simple tests can help teams avoid overinvesting in campaigns that only take credit for demand created elsewhere.
Marketing does not end when a customer converts. For many businesses, growth depends on activation, repeat purchase, renewal, upsell, referral, and long-term customer value.
Activation rate measures whether new customers reach the first meaningful milestone. For a SaaS product, this might be completing onboarding or using a core feature. For a service business, it might be attending an initial consultation or submitting required documents. For ecommerce, it might be a second purchase or account setup.
A weak activation rate can indicate a gap between acquisition promise and customer experience. Marketing should monitor this because better onboarding messages, expectation-setting, and education can improve outcomes.
Retention shows how many customers continue over time. Churn shows how many leave. These metrics are essential for subscription, membership, SaaS, and repeat-purchase models.
Marketing dashboards should segment retention by acquisition source when possible. If one channel brings customers who churn quickly, its apparent CAC may be understated. If another channel brings loyal customers, it may deserve more investment even if the upfront cost is higher.
Expansion revenue comes from upsells, cross-sells, add-ons, or increased usage. Repeat purchase revenue comes from customers buying again.
These metrics help prove the value of lifecycle marketing, email nurture, customer education, loyalty programs, and personalized offers. They also encourage teams to optimize for customer quality rather than raw acquisition volume.
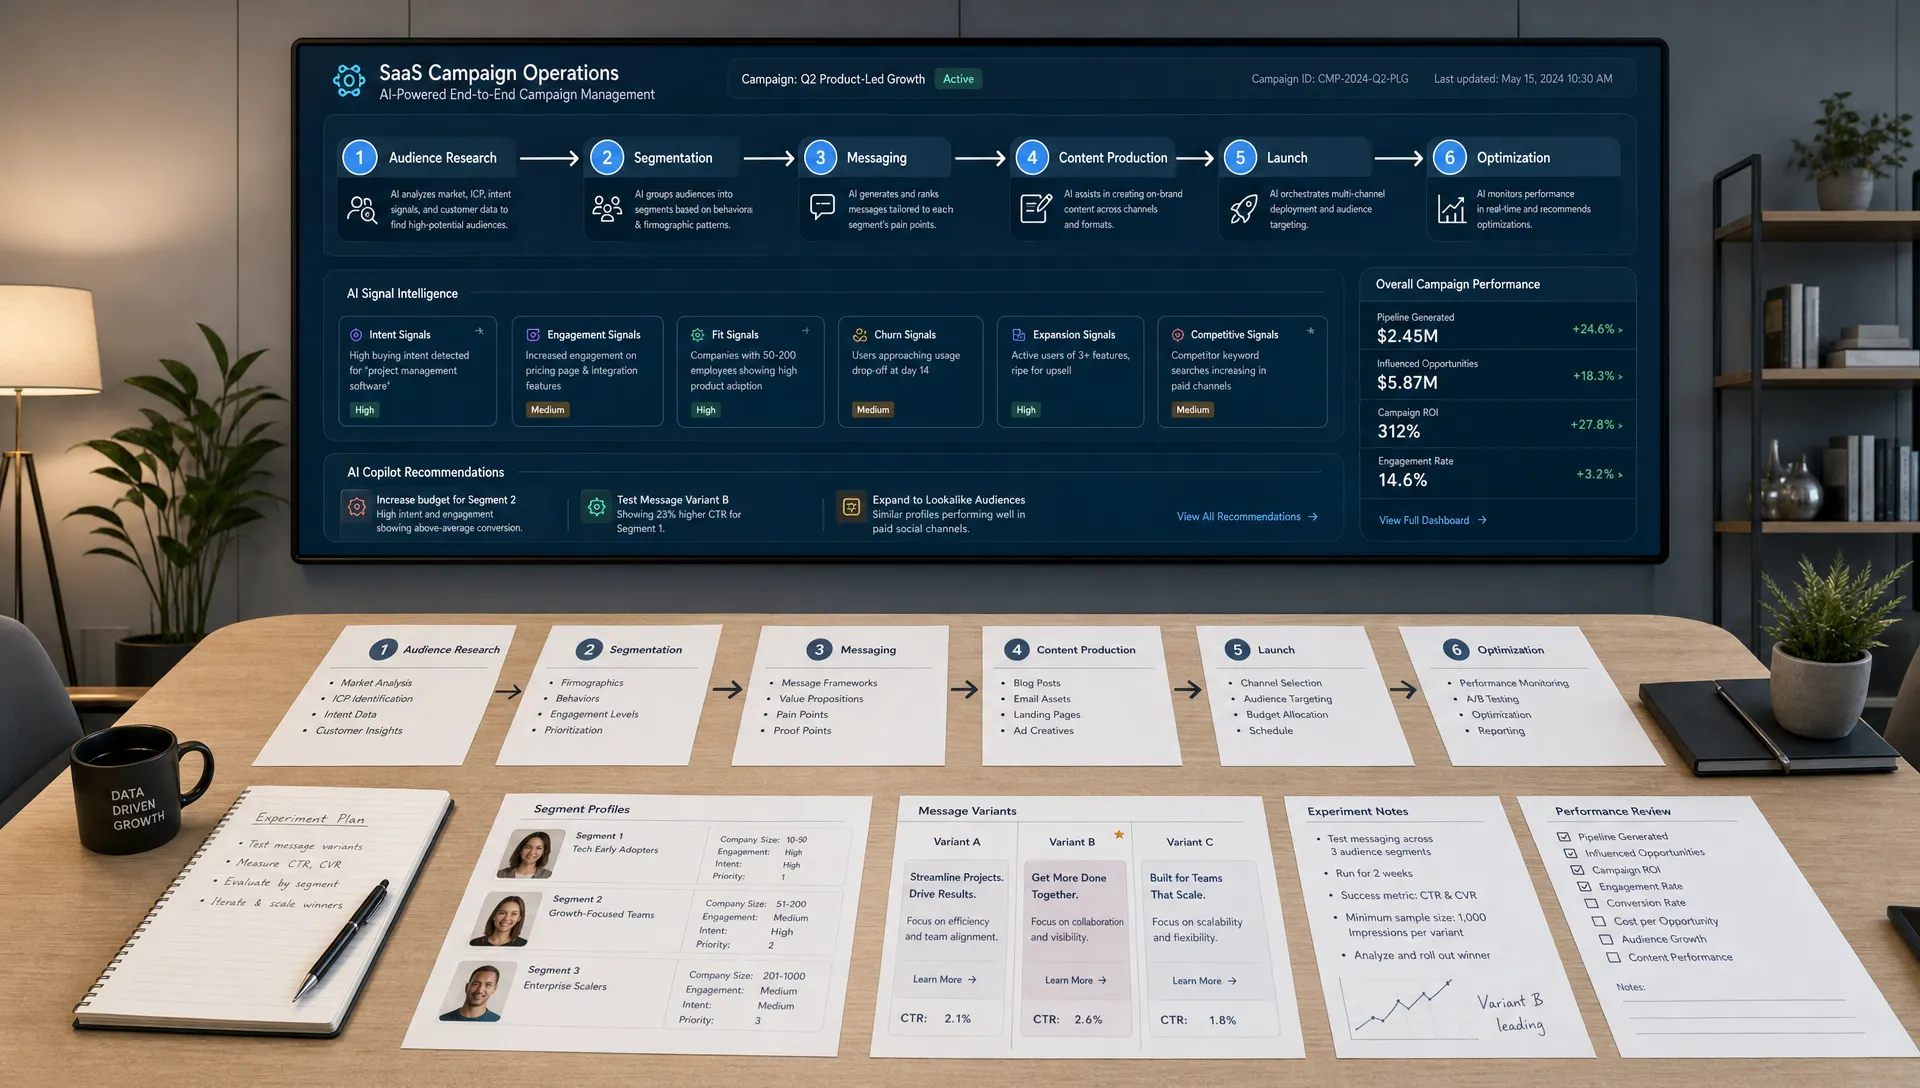
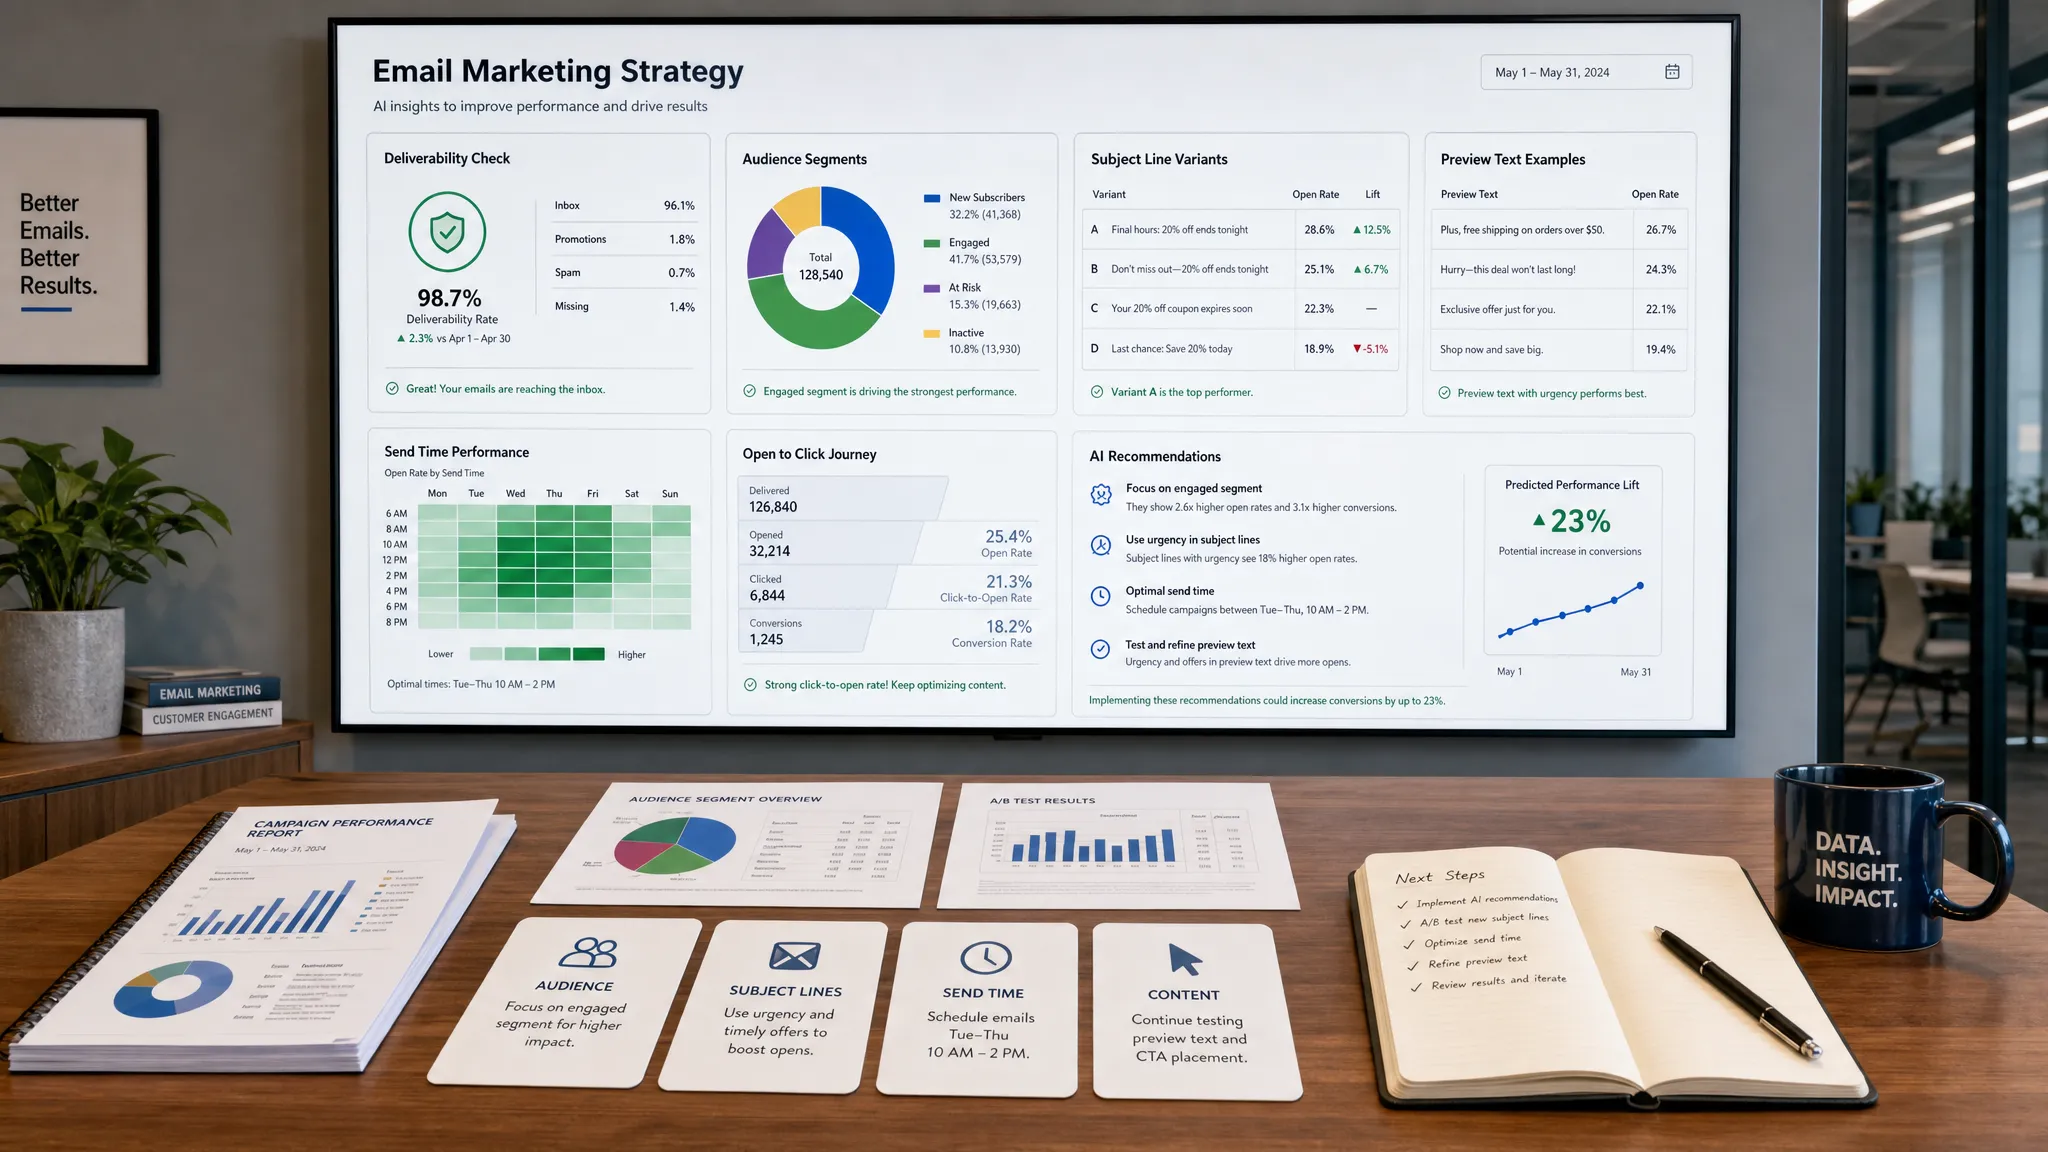
AI marketing and automation can improve speed, personalization, and analysis, but only if teams track whether AI is improving outcomes. A modern marketing dashboard should include metrics that evaluate automation quality as well as campaign performance.
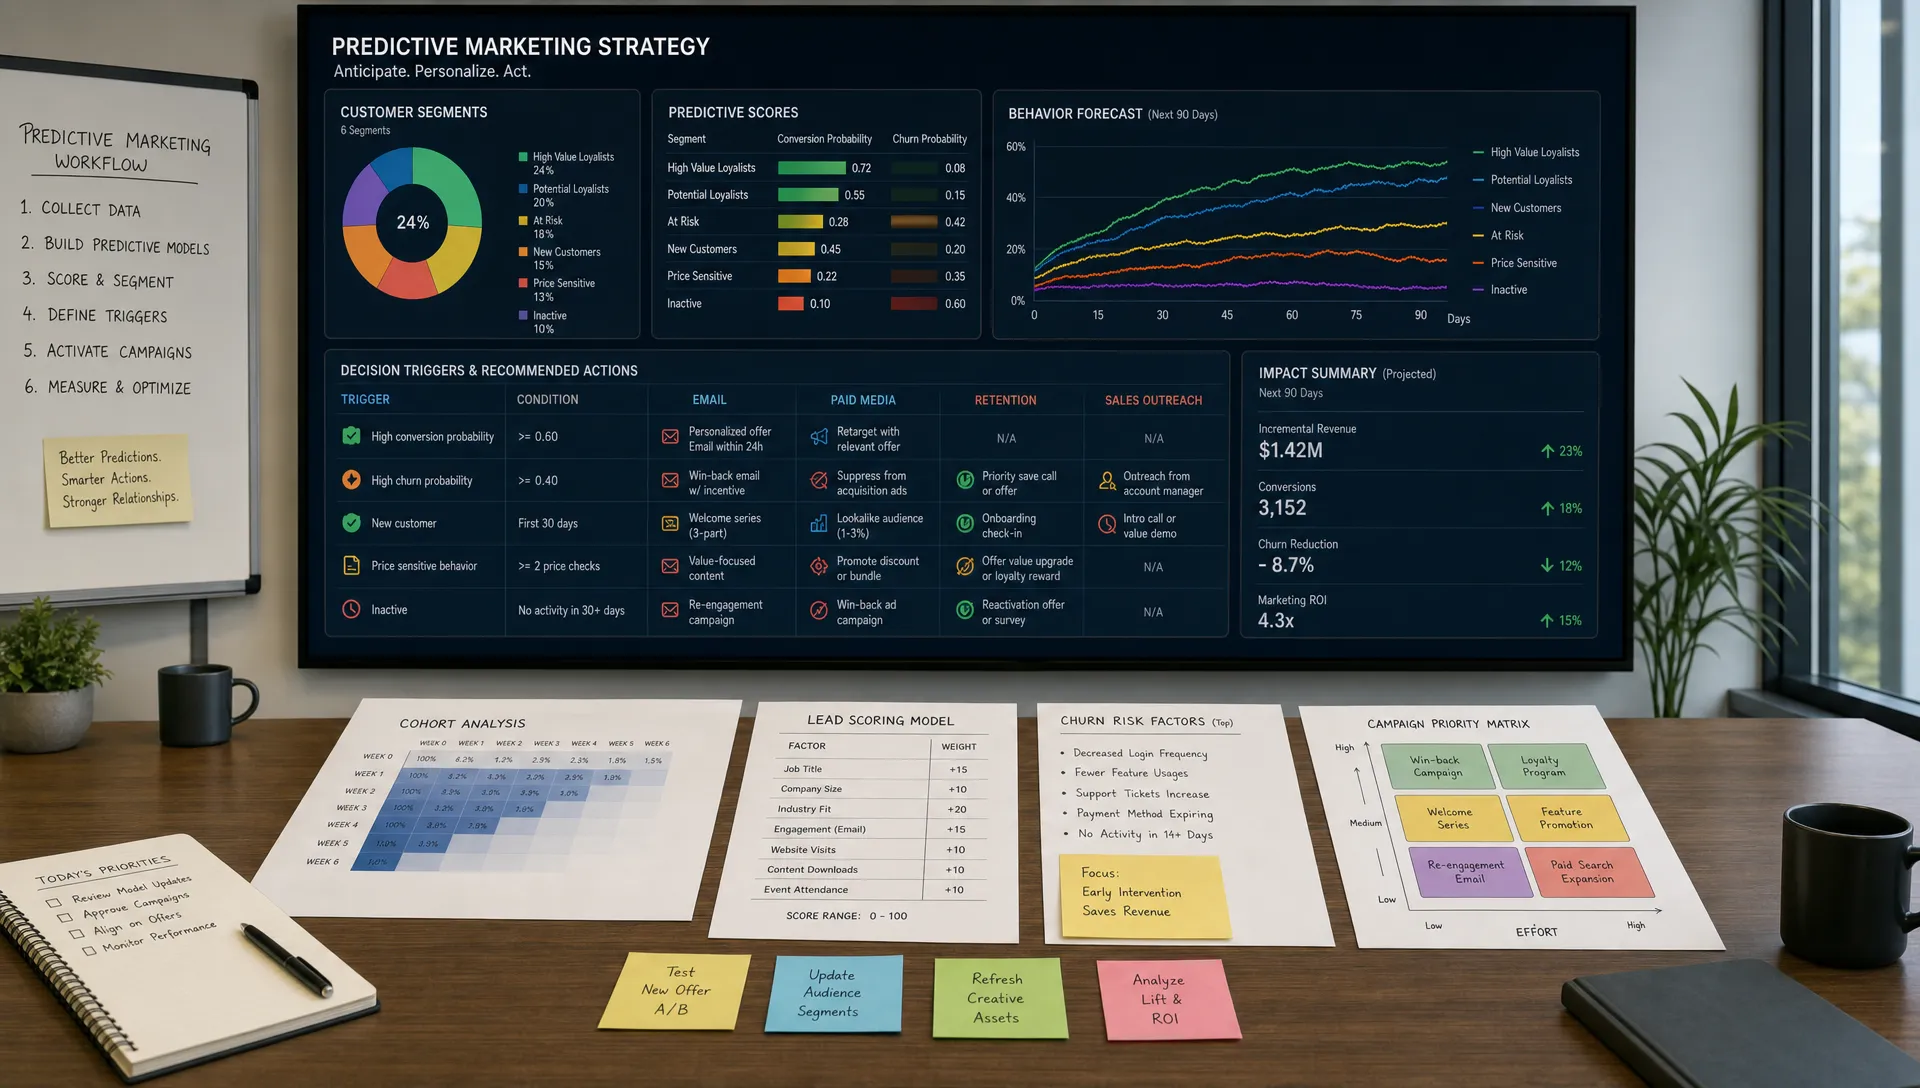
If your team uses AI-powered analytics for forecasting traffic, pipeline, revenue, or campaign performance, track forecast accuracy over time. A forecast is useful only if it improves planning decisions.
Compare predicted results with actual results, then review the variance. Large gaps may reveal seasonality, data quality issues, changing buyer behavior, or unrealistic assumptions.
Marketing workflow automation should reduce manual effort without creating errors. Track the percentage of automations that complete successfully, along with failures such as broken triggers, incorrect segmentation, duplicate sends, or CRM sync issues.
This metric is especially useful for teams using automated nurture sequences, lead scoring, content workflows, and campaign routing.
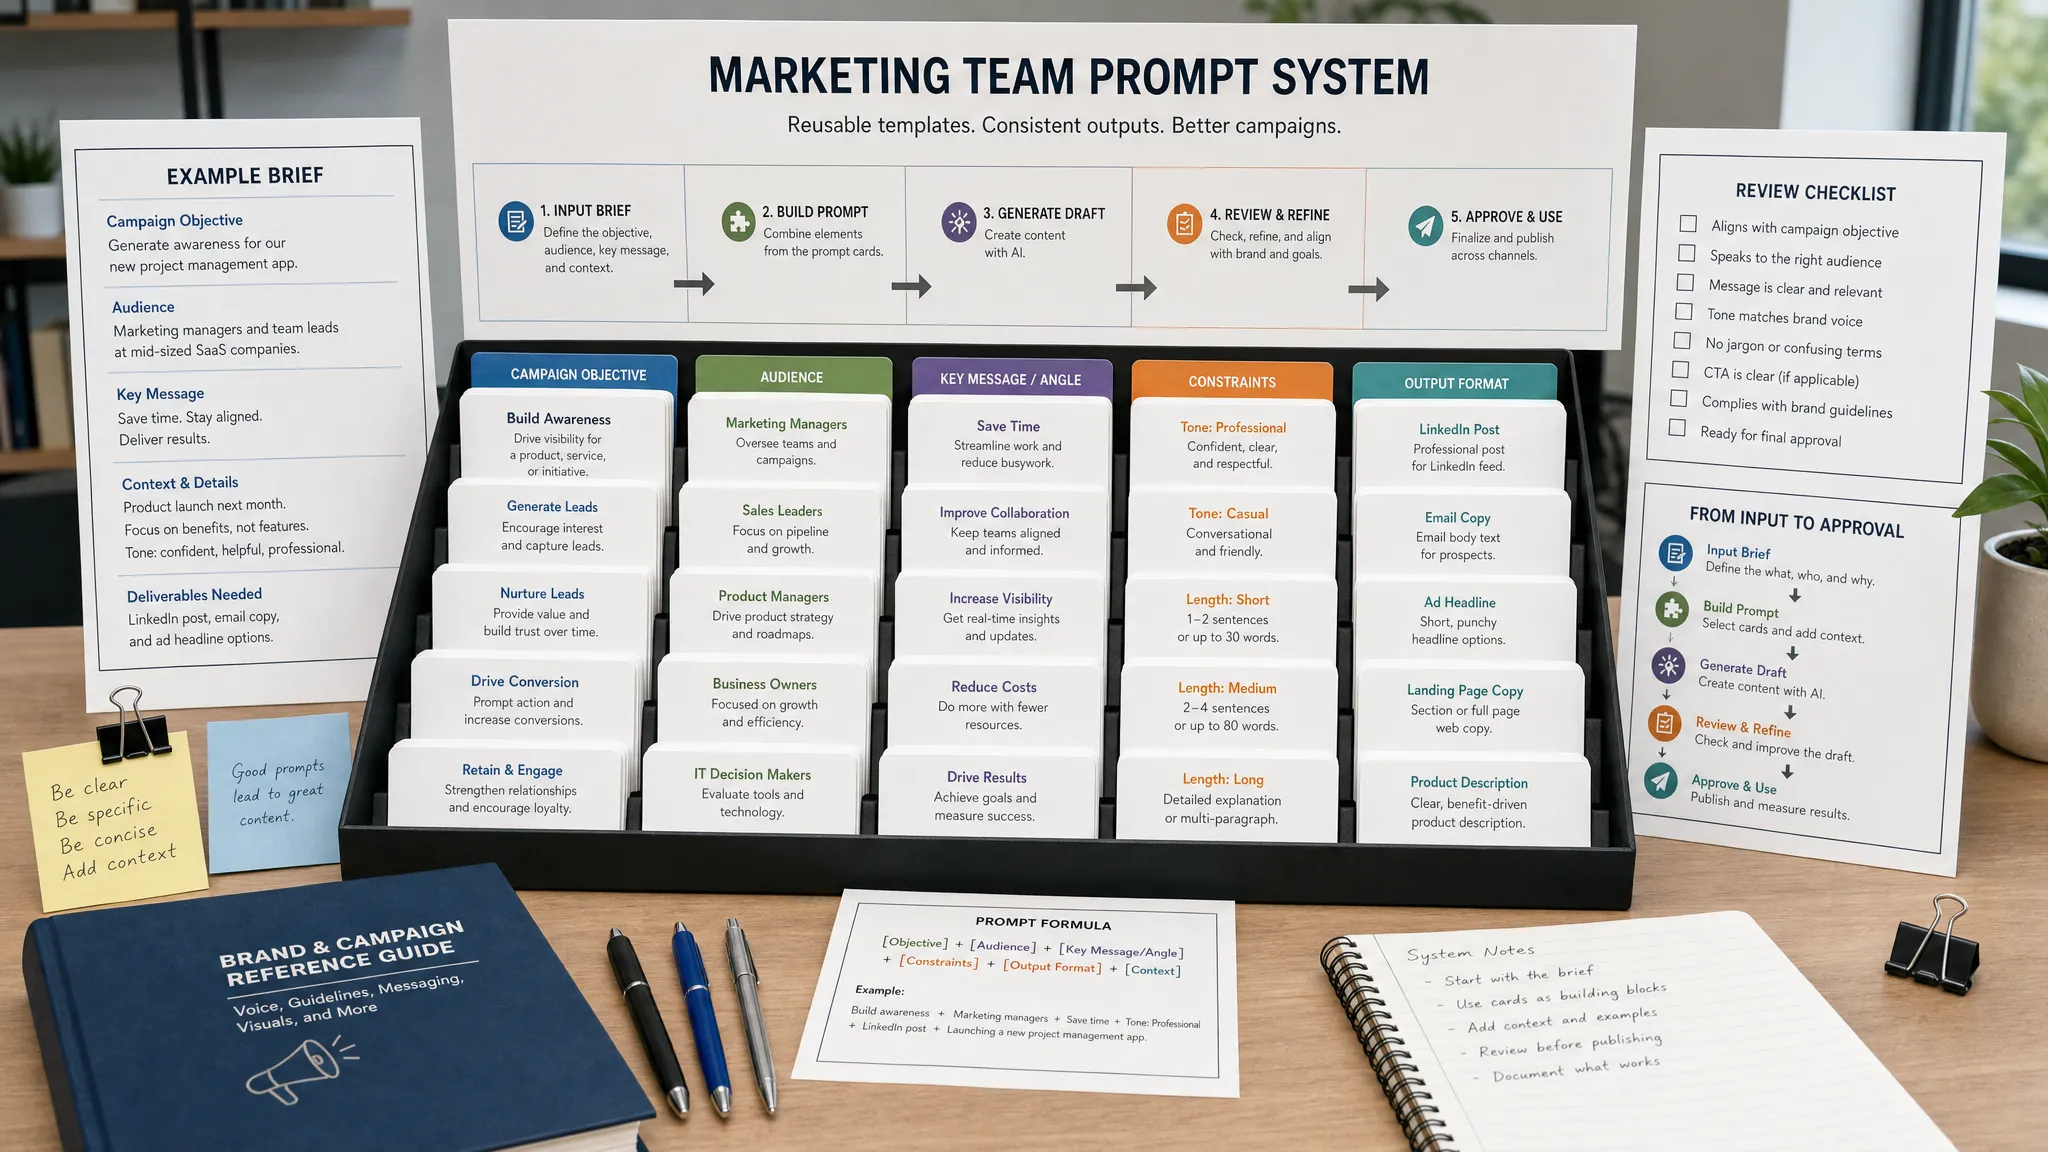
If AI supports content creation, track output quality and business impact. Useful metrics include time to publish, editorial revision rate, organic conversions, engagement quality, ranking improvements, and pipeline influenced by AI-assisted content.
The point is not to prove that AI creates more content. The point is to prove that AI helps create useful content more efficiently. For teams building AI into their digital marketing strategies, this broader view aligns with how smart teams approach digital marketing and AI in practice.
A dashboard is only as reliable as the data behind it. If tracking is broken, attribution is inconsistent, or CRM fields are messy, even the most beautiful report can mislead decision-makers.
Include a small data quality section in your dashboard, especially if marketing performance informs budget decisions.
Useful data quality indicators include:
These metrics may not feel exciting, but they protect your team from making expensive decisions based on incomplete data.
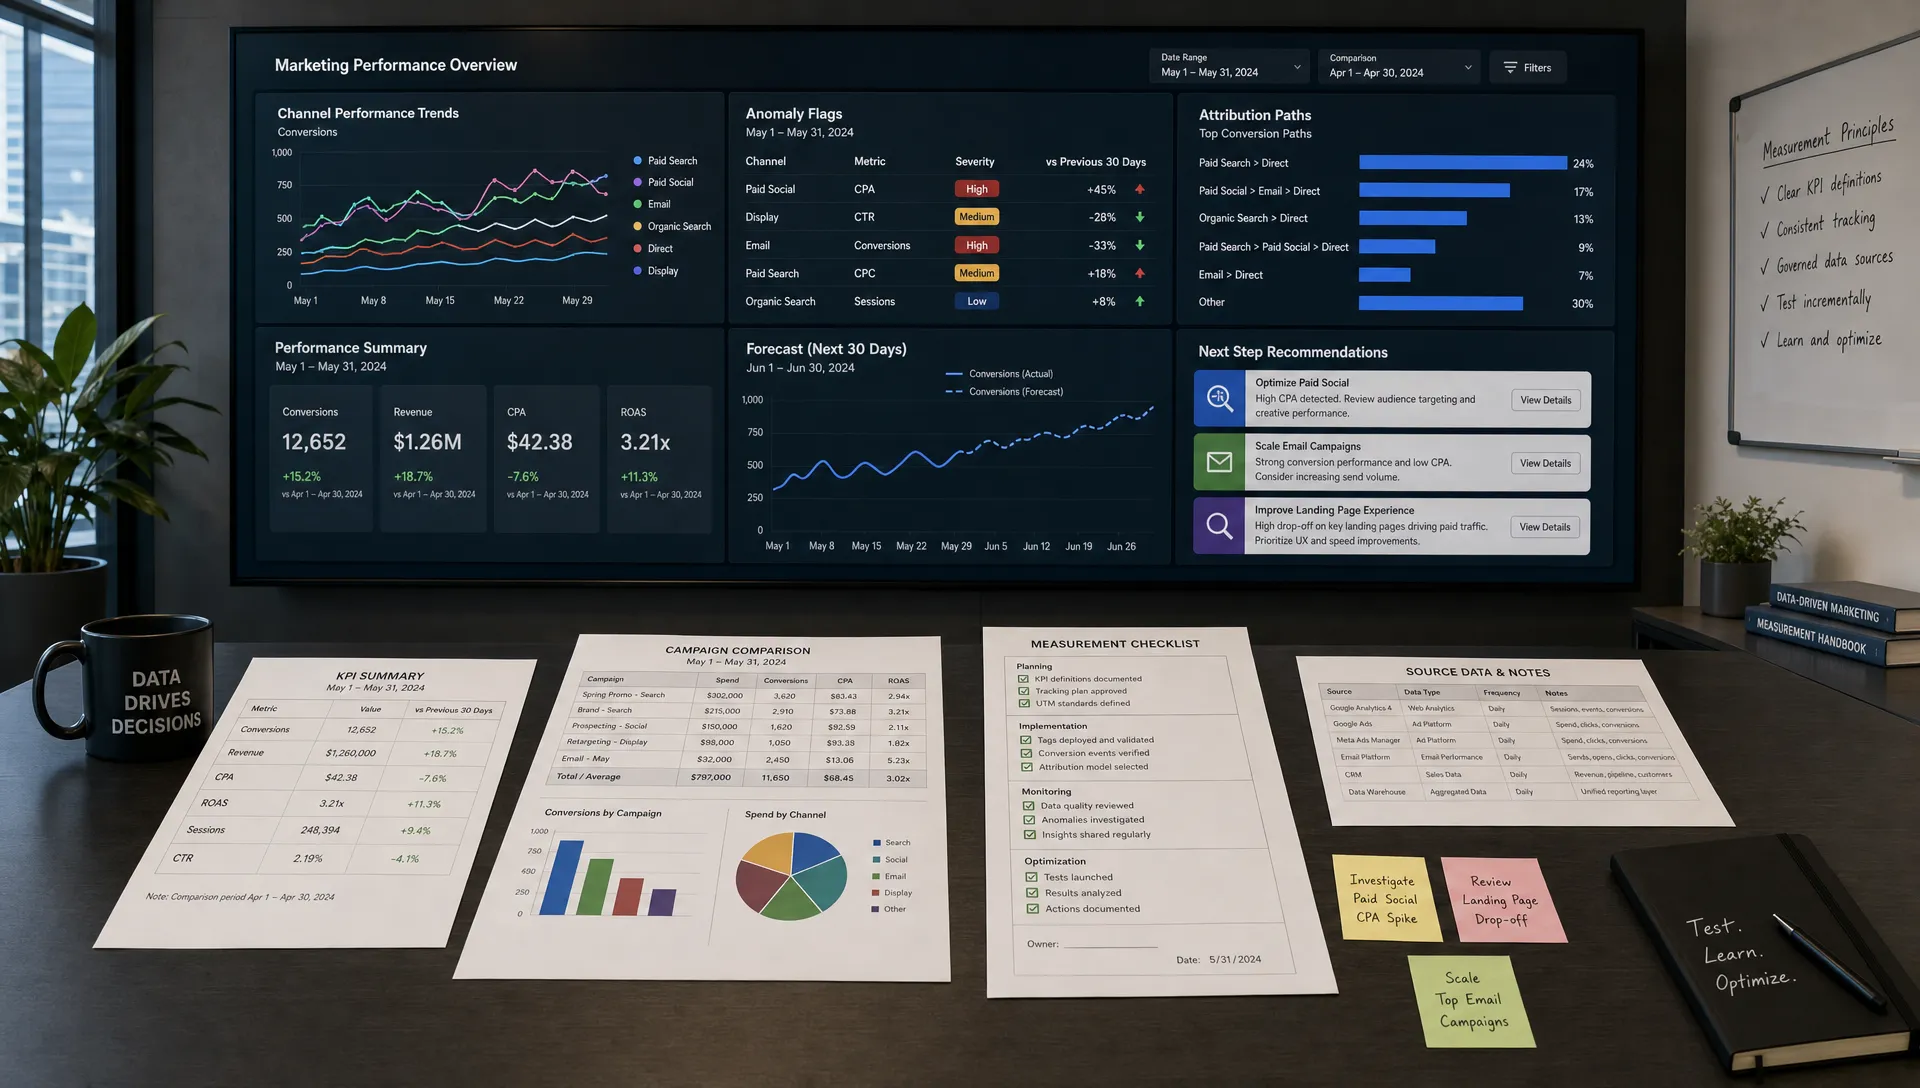
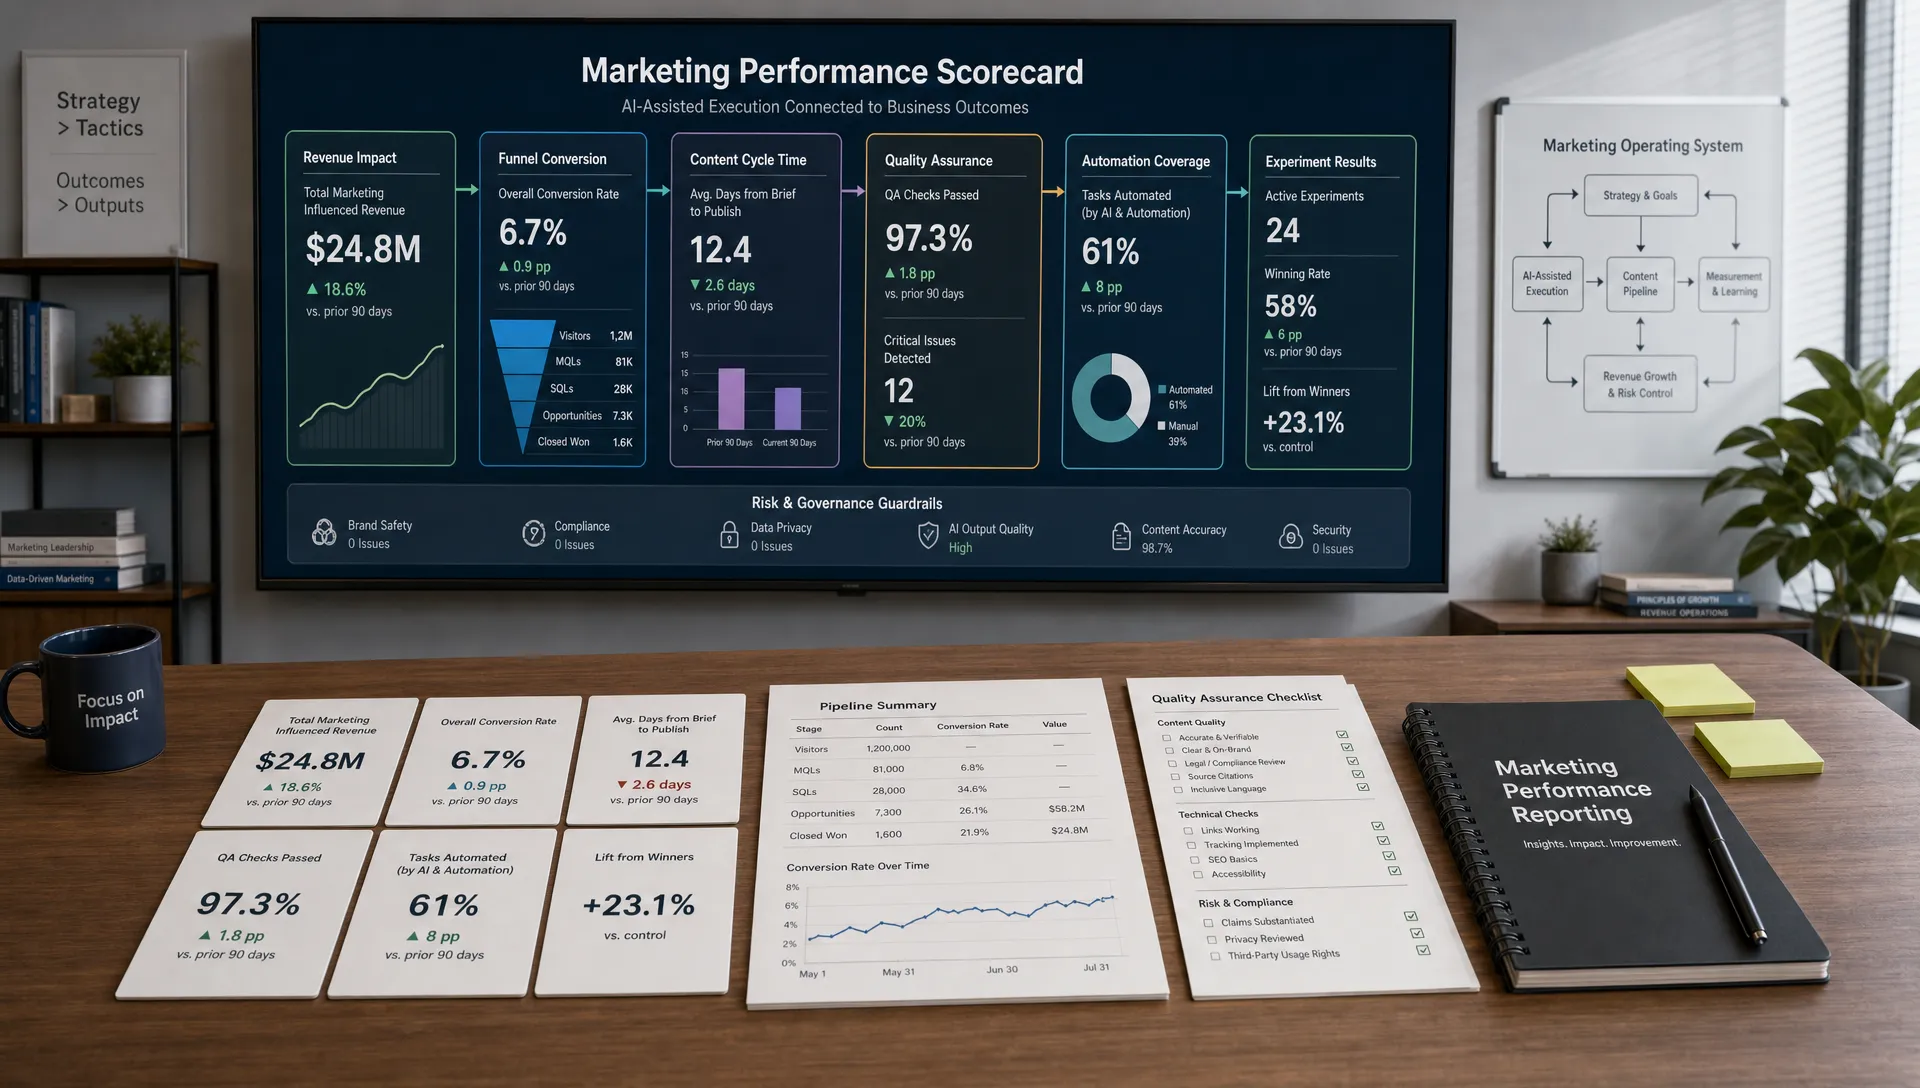
The best dashboards are designed around decisions, not decoration. If a stakeholder has to hunt through 40 charts to understand performance, the dashboard has already failed.
A practical structure is:
Use visual hierarchy. Put the most important metrics first. Show trends, not just snapshots. Add benchmarks or targets where possible. A number without context forces people to guess whether performance is good or bad.
Also, avoid mixing every reporting cadence into one view. Daily dashboards should flag operational issues. Weekly dashboards should support optimization. Monthly dashboards should evaluate strategic performance. Quarterly dashboards should inform budget, positioning, and growth planning.
Many teams have dashboards, but fewer have dashboards that improve decisions. Watch for these common problems.
First, avoid vanity metric overload. Impressions, reach, and likes can help diagnose awareness, but they should not dominate a performance dashboard unless awareness is the primary objective.
Second, avoid blended averages without segmentation. Overall conversion rate may look stable while mobile performance collapses or one channel quietly becomes unprofitable.
Third, do not rely only on platform attribution. Ad platforms optimize for their own reporting environments. A stronger dashboard reconciles platform data with analytics, CRM, ecommerce, and finance systems.
Fourth, do not build dashboards that only report the past. Good dashboards include leading indicators such as qualified traffic, conversion rate shifts, pipeline creation, content decay, and forecast variance.
Finally, do not let dashboards become static. As strategy changes, the dashboard should change too. The right metrics for a launch month may not be the right metrics for a retention-focused quarter.
What are the most important marketing dashboard metrics? The most important metrics are usually revenue, pipeline, CAC, conversion rate, cost per qualified lead, ROAS or MER, retention, and channel-level performance. The exact mix depends on your business model and goals.
How many metrics should a marketing dashboard include? A focused dashboard often works best with 8 to 15 primary metrics, supported by deeper diagnostic views. If every metric has equal visibility, none of them feels important.
What is the difference between a KPI and a metric? A metric is any measurable data point. A KPI is a key performance indicator tied directly to a strategic goal. For example, sessions are a metric, while qualified pipeline from organic search may be a KPI.
Should marketing dashboards include AI analytics? Yes, if AI is part of your workflow. Track forecast accuracy, automation success rate, content performance, time saved, and data quality so AI-driven marketing supports measurable outcomes.
How often should marketing dashboards be reviewed? Operational dashboards may be checked daily, campaign dashboards weekly, and executive dashboards monthly or quarterly. The review cadence should match the decision the dashboard supports.
The marketing dashboard metrics that matter most are the ones that help your team act. They show whether growth is profitable, whether campaigns attract the right audience, whether the funnel is converting, and whether customers continue to create value after the first sale.
Start with business goals, choose metrics that influence decisions, and keep your dashboard clean enough for people to use consistently. Then layer in AI-powered analytics, automation tracking, and data quality checks to make reporting more predictive, reliable, and actionable.
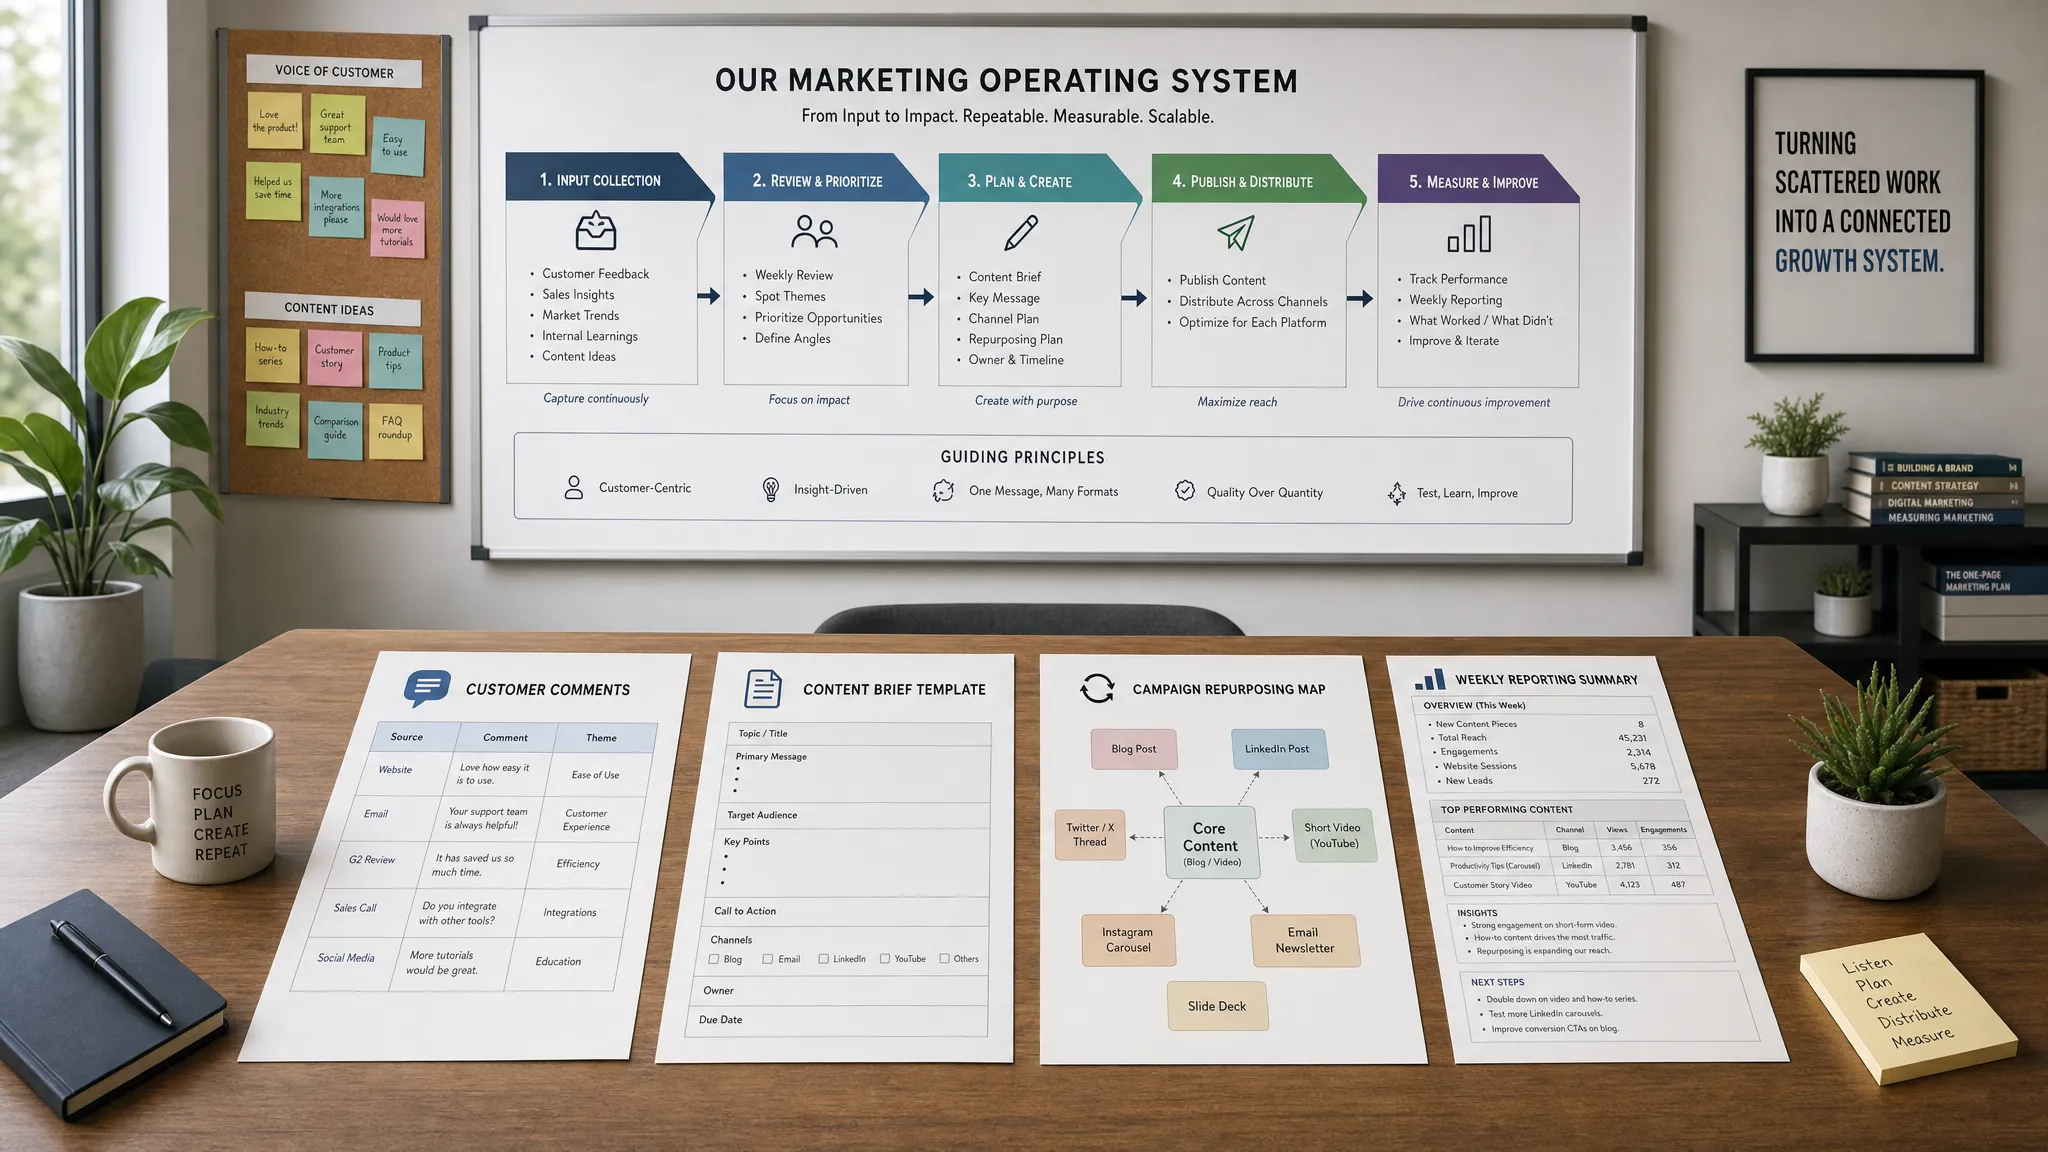
If your team wants practical tools, guides, and resources for AI marketing, analytics, SEO, content creation, and workflow automation, explore AIMarketer Hub to build a smarter marketing operating system around the metrics that matter.