AI can accelerate almost every part of marketing, from audience research and content creation to paid media optimization and reporting. But faster execution does not automatically mean better performance. Without the right AI marketing metrics, teams can produce more campaigns, more copy, and more dashboards while still missing the outcomes that matter.
The goal is not to track every possible number. The goal is to connect AI-assisted work to business impact, operational efficiency, content quality, and risk control. A strong measurement system helps leaders answer a practical question: Is AI making our marketing smarter, faster, and more profitable, or just busier?
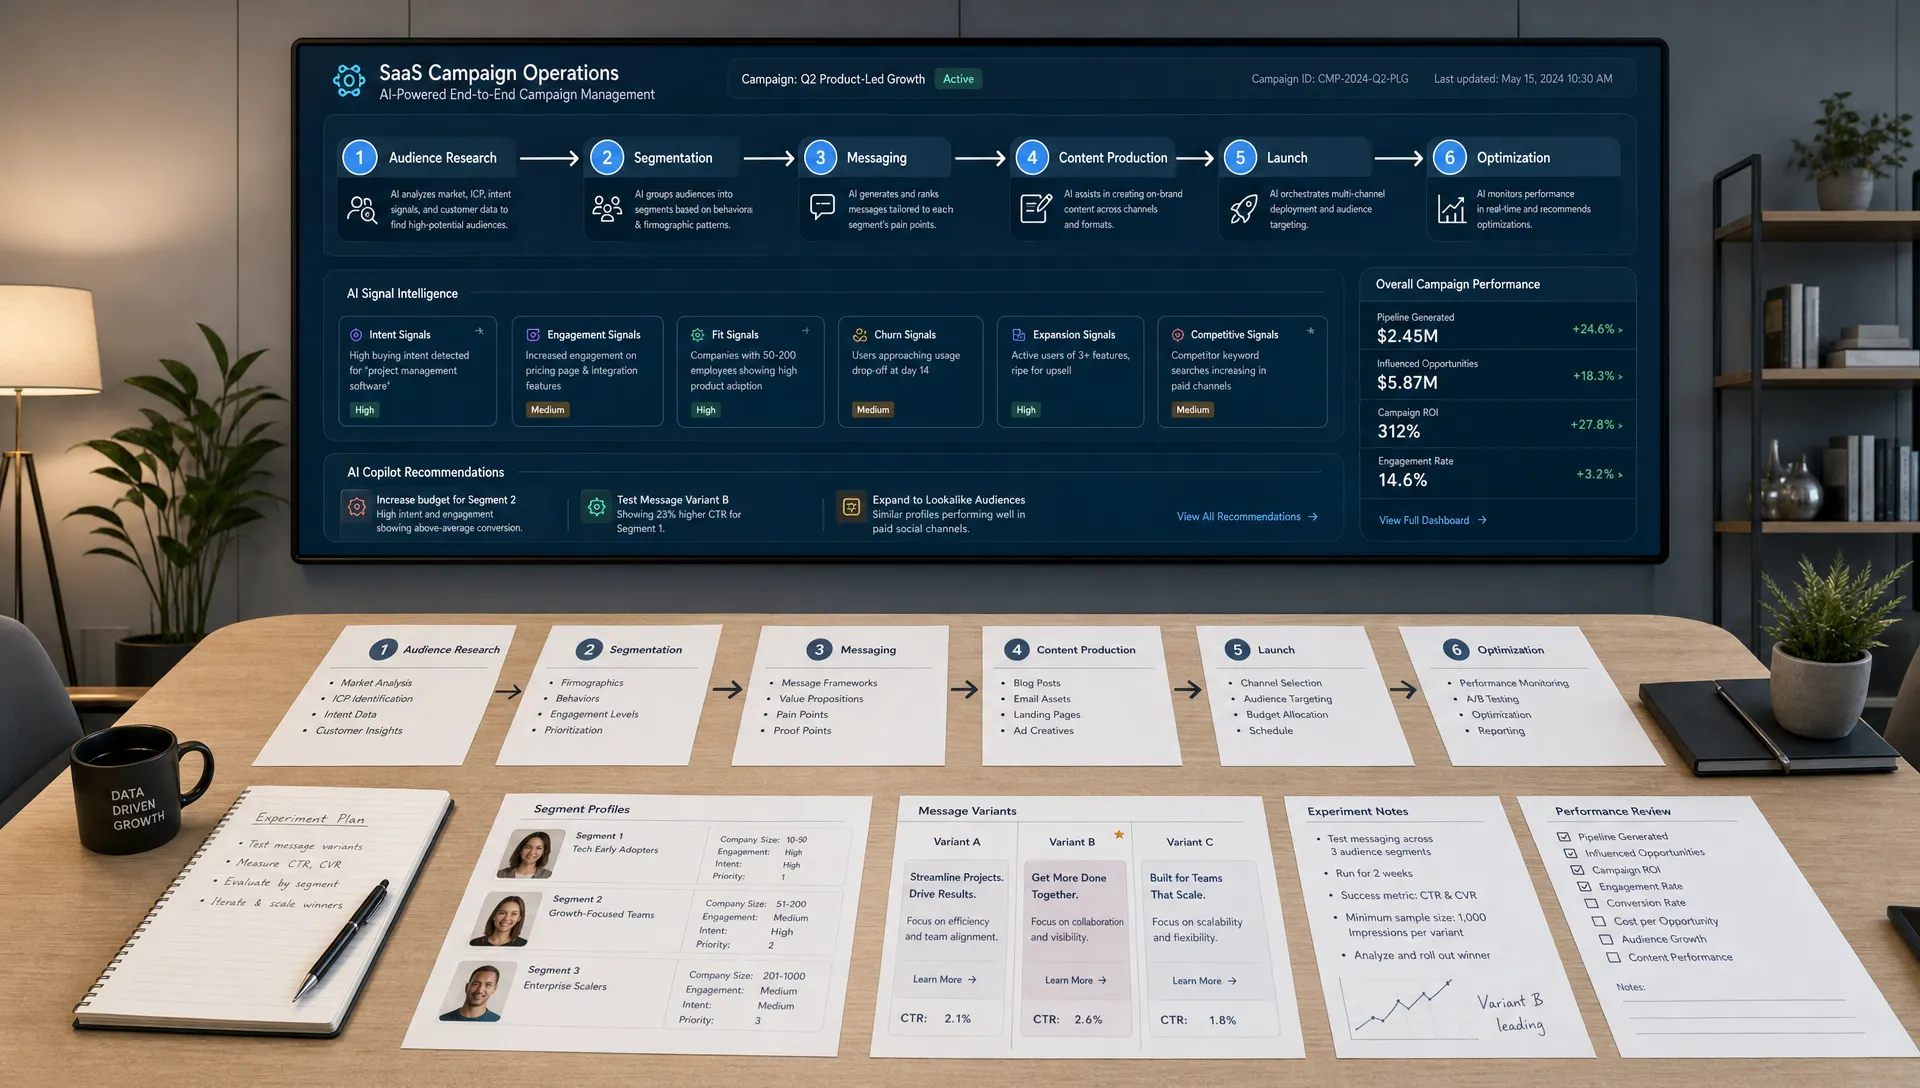
Below is a practical scorecard your team can adapt, whether you are just introducing AI tools or already using marketing workflow automation across multiple channels.
A useful AI marketing metric should influence decisions. If a metric does not help you improve budget allocation, workflow design, campaign quality, or customer experience, it probably belongs in a secondary report rather than your core dashboard.
Before choosing metrics, define three things: your baseline, your business goal, and your owner. For example, if your team uses AI for content production, measure the current average time to publish, the target improvement, and who is responsible for maintaining quality. Without that baseline, it is easy to celebrate volume while missing whether performance improved.
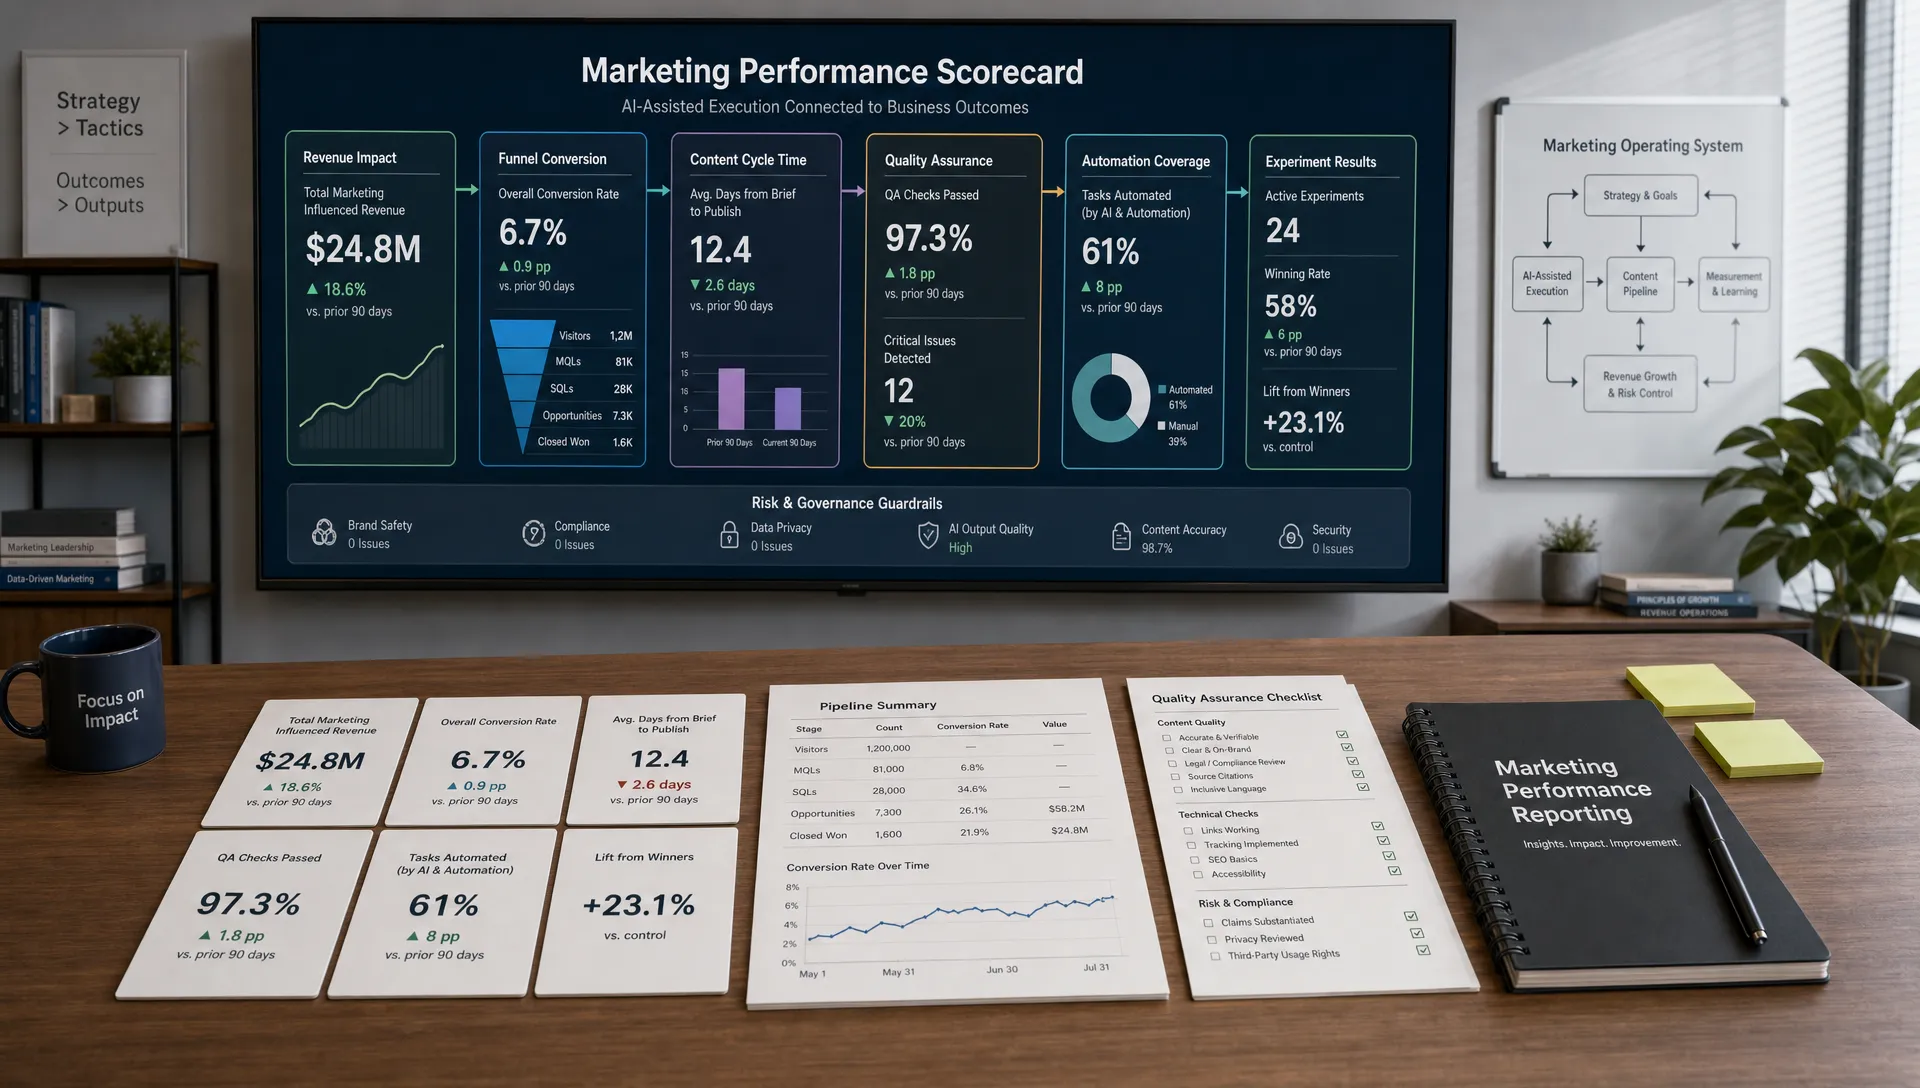
A balanced AI marketing scorecard usually includes:
This balance matters because AI can improve one area while weakening another. A team may publish twice as fast but see lower conversion rates if messaging becomes generic. Another team may reduce ad management time but increase wasted spend if automation is not monitored. Good metrics catch those tradeoffs early.
Revenue metrics are the first place to look because they keep AI initiatives tied to business outcomes. These metrics are especially important when leaders are deciding whether to expand AI tools, approve new automation workflows, or invest in AI-powered analytics.
AI-influenced revenue estimates how much closed revenue can be connected to campaigns, content, or workflows supported by AI. This does not mean claiming that AI deserves all credit for a sale. Instead, create a clear attribution rule.
For example, revenue may be tagged as AI-influenced when a prospect engaged with AI-assisted email sequences, visited AI-generated landing pages, or entered the CRM through AI-supported ad campaigns. The key is consistency. Use campaign tags, CRM fields, and documented definitions so the metric is credible.
This metric is most useful when compared against a non-AI baseline. If AI-assisted campaigns generate more qualified opportunities at the same or lower cost, the business case becomes much easier to defend.
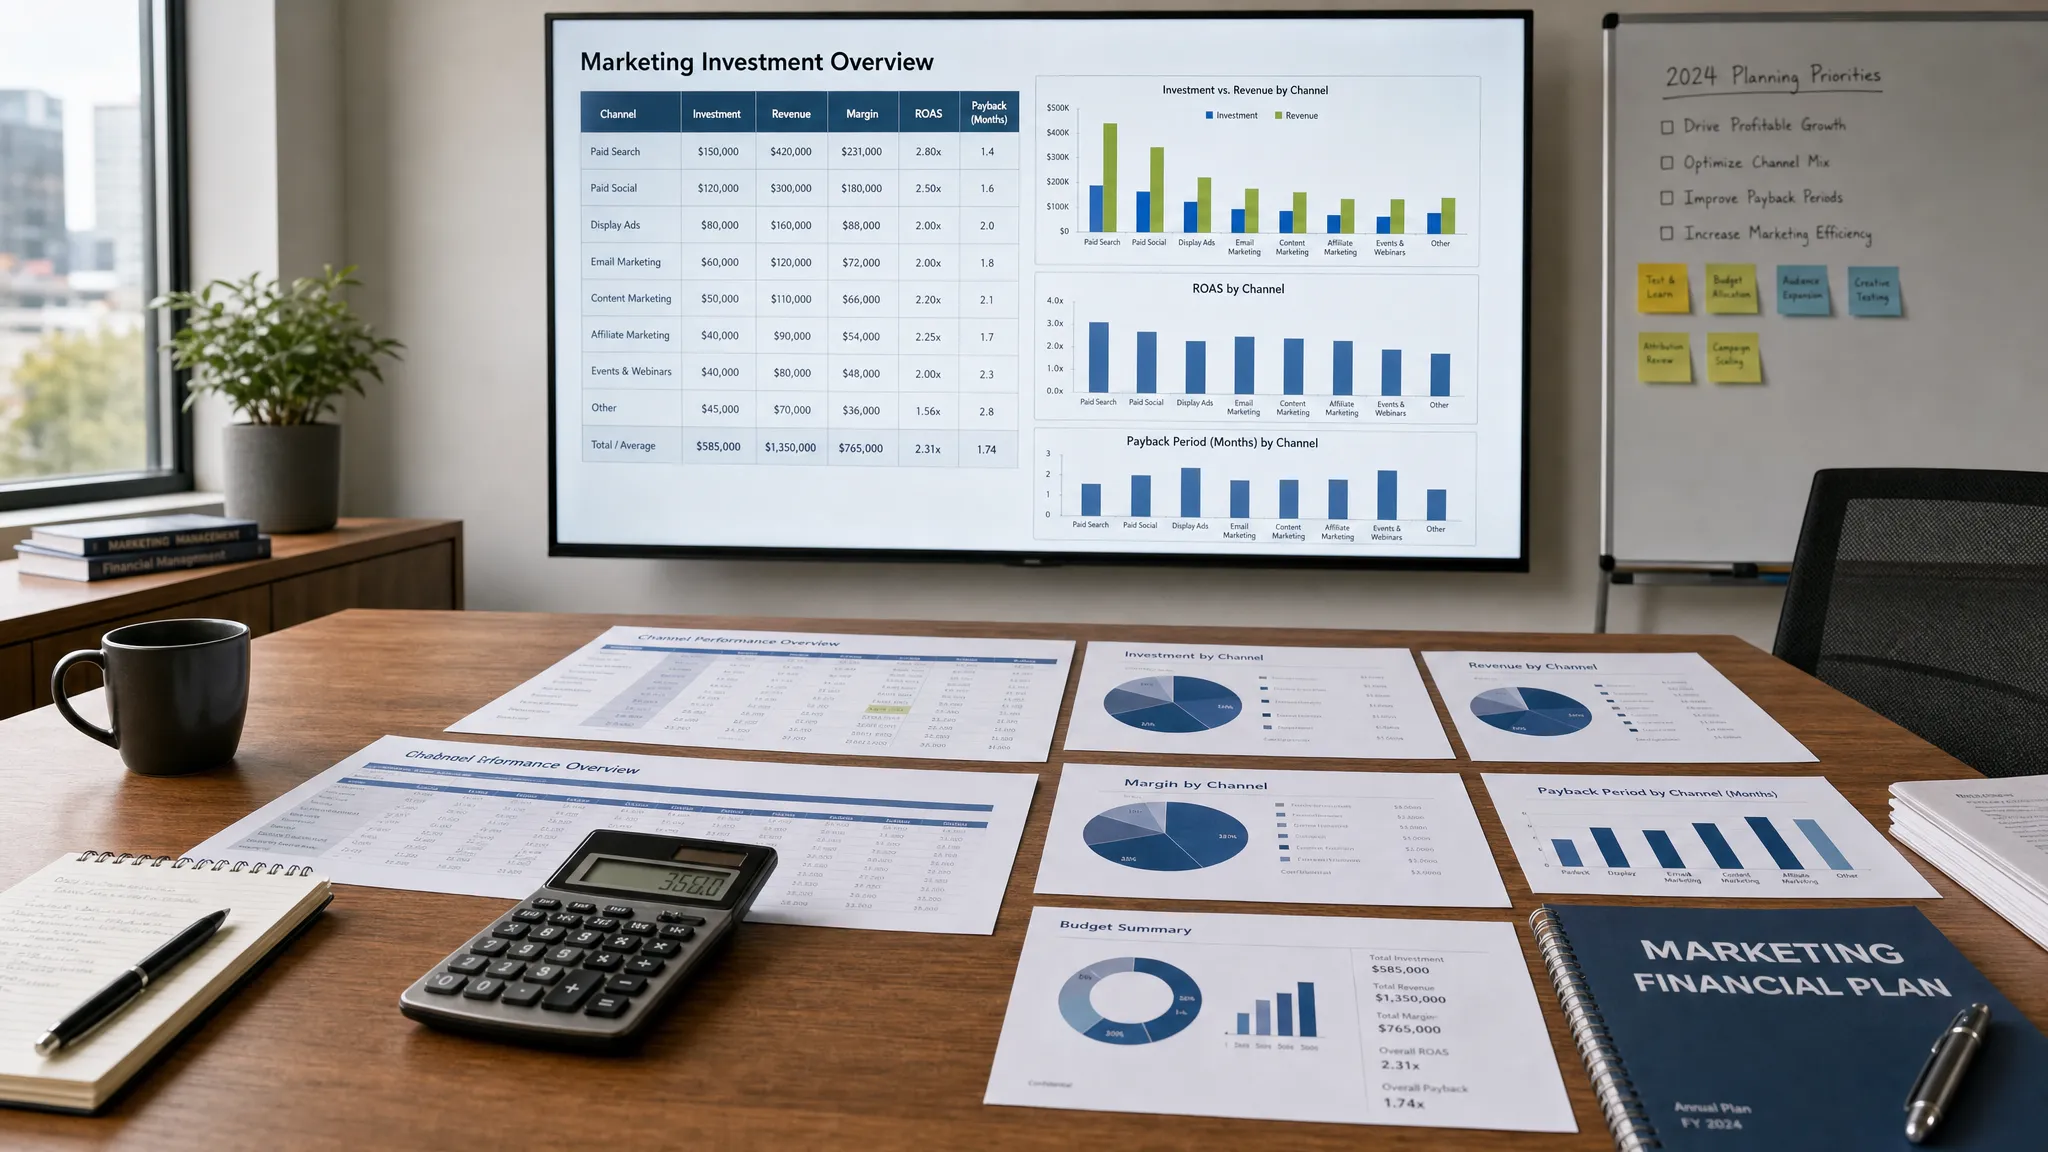
Customer acquisition cost, often shortened to CAC, measures how much you spend to acquire a new customer. AI marketing automation should ideally reduce CAC by improving targeting, increasing conversion rates, or lowering production costs.
However, CAC can be misleading if viewed alone. A cheaper acquisition strategy is not automatically better if it attracts low-value customers or increases churn. Compare CAC with lead quality, average deal size, and retention data.
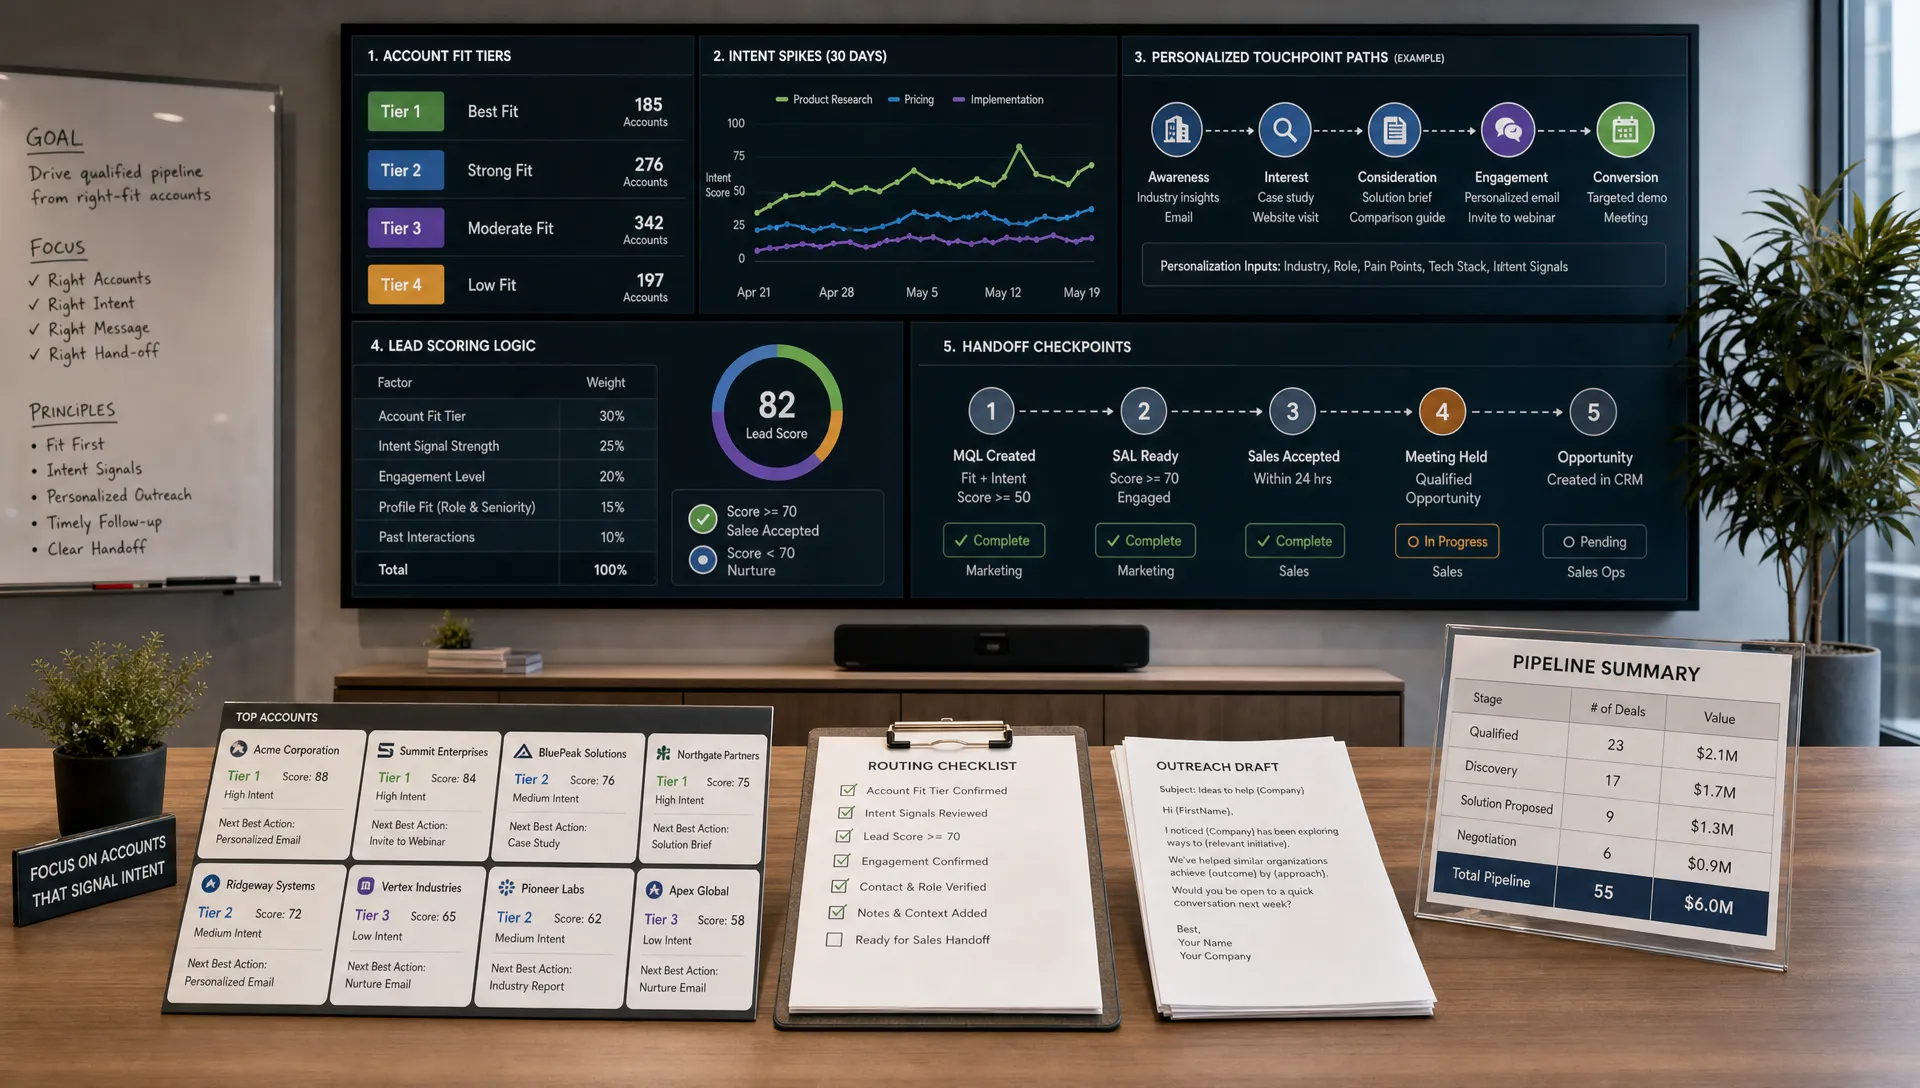
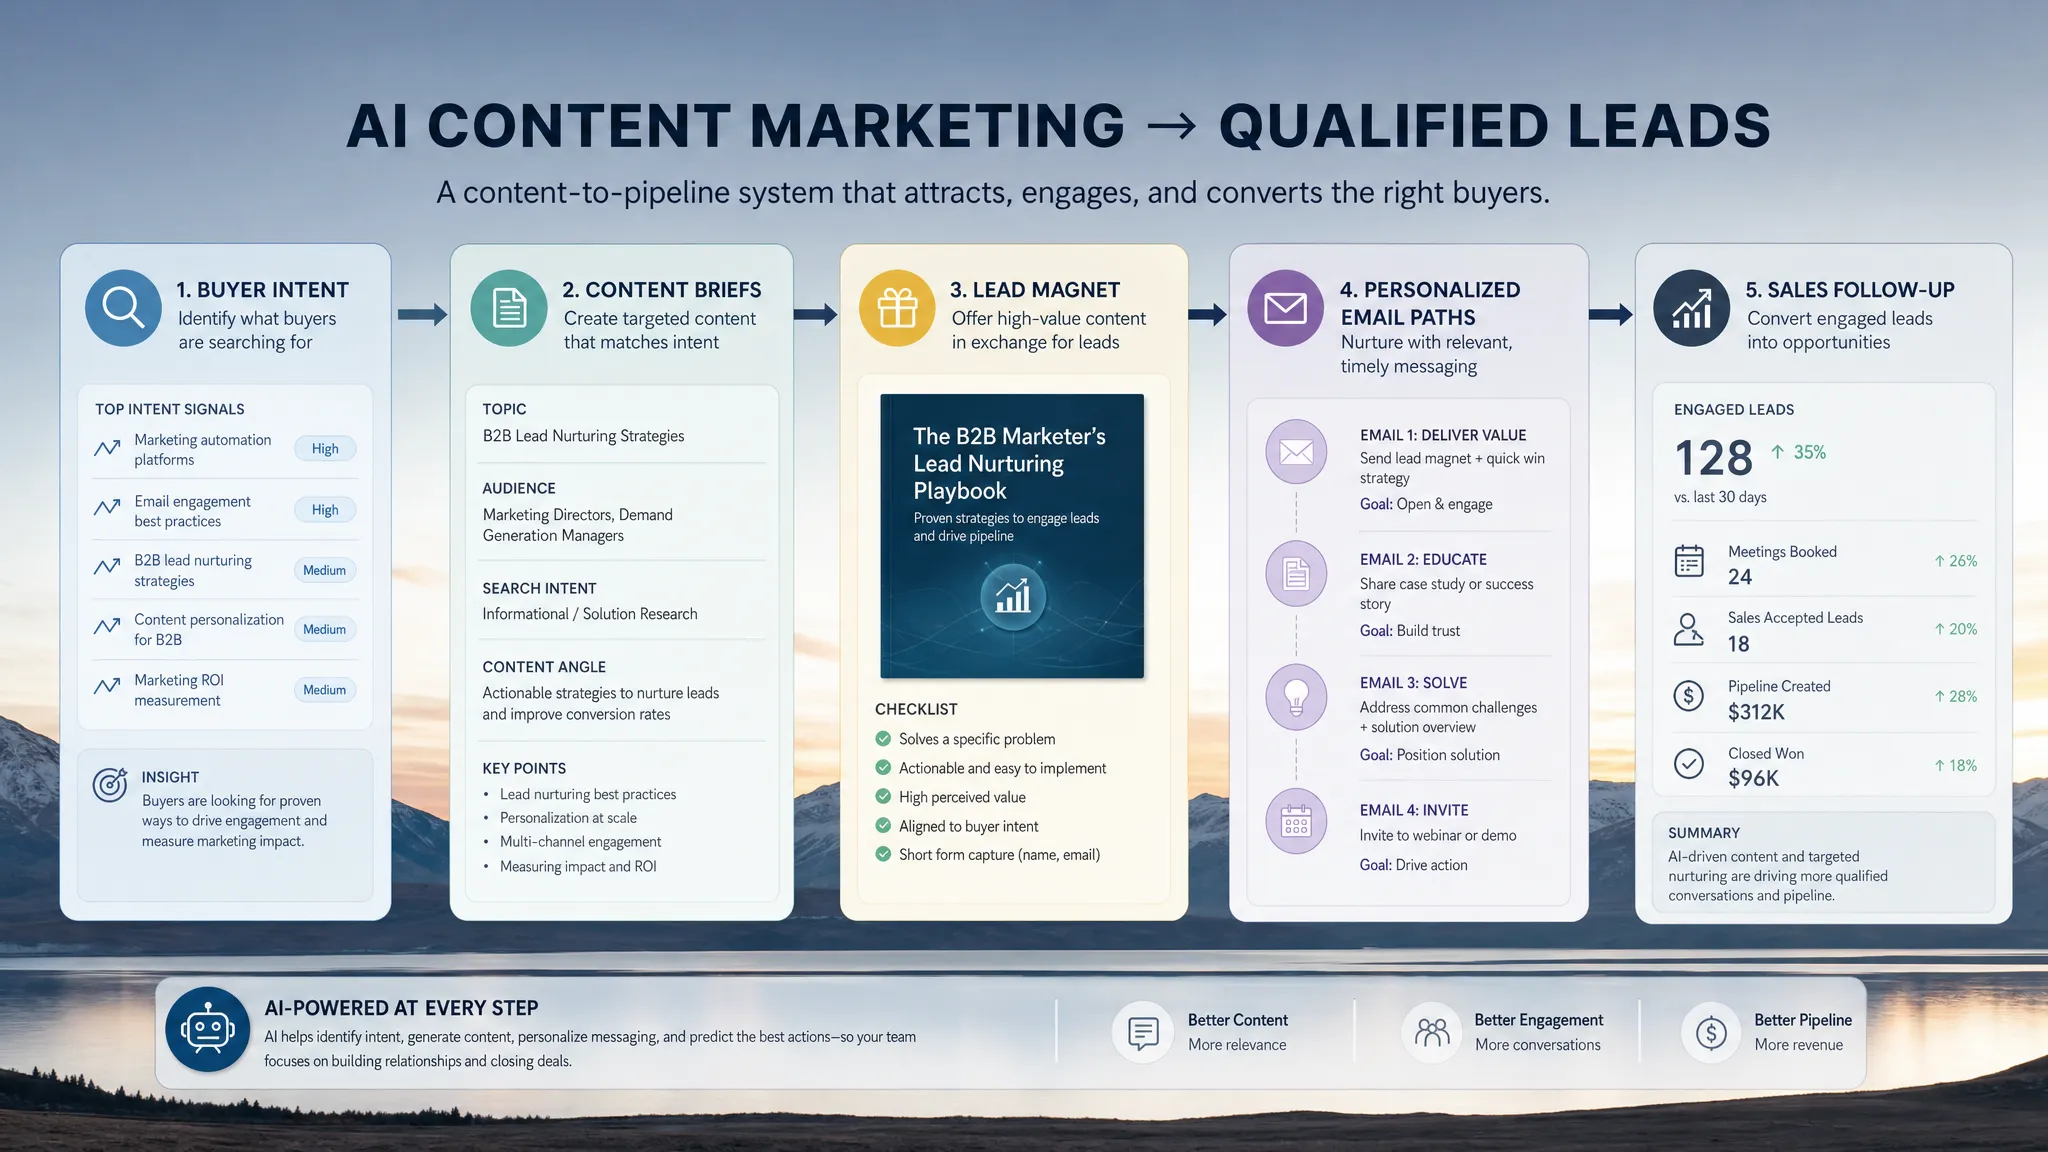
For B2B teams, marketing-sourced pipeline is often more useful than top-line lead volume. AI can help generate more leads, but the real question is whether those leads become meaningful opportunities.
Track how much qualified pipeline originates from AI-assisted campaigns. Segment by channel, audience, and campaign type. This helps you identify where AI adds the most value, such as account-based content, webinar follow-ups, or personalized nurture sequences.
Pipeline velocity shows how quickly prospects move from first touch to closed deal. AI can influence this metric by improving lead scoring, personalization, follow-up timing, and sales enablement content.
If AI-assisted nurture flows shorten the sales cycle without reducing deal quality, that is a strong signal. If velocity improves but win rates drop, the messaging may be creating urgency without enough fit.
Funnel metrics show where AI is improving, or hurting, the customer journey. They are especially helpful for diagnosing whether a campaign problem is related to traffic quality, messaging, offer strength, or follow-up.
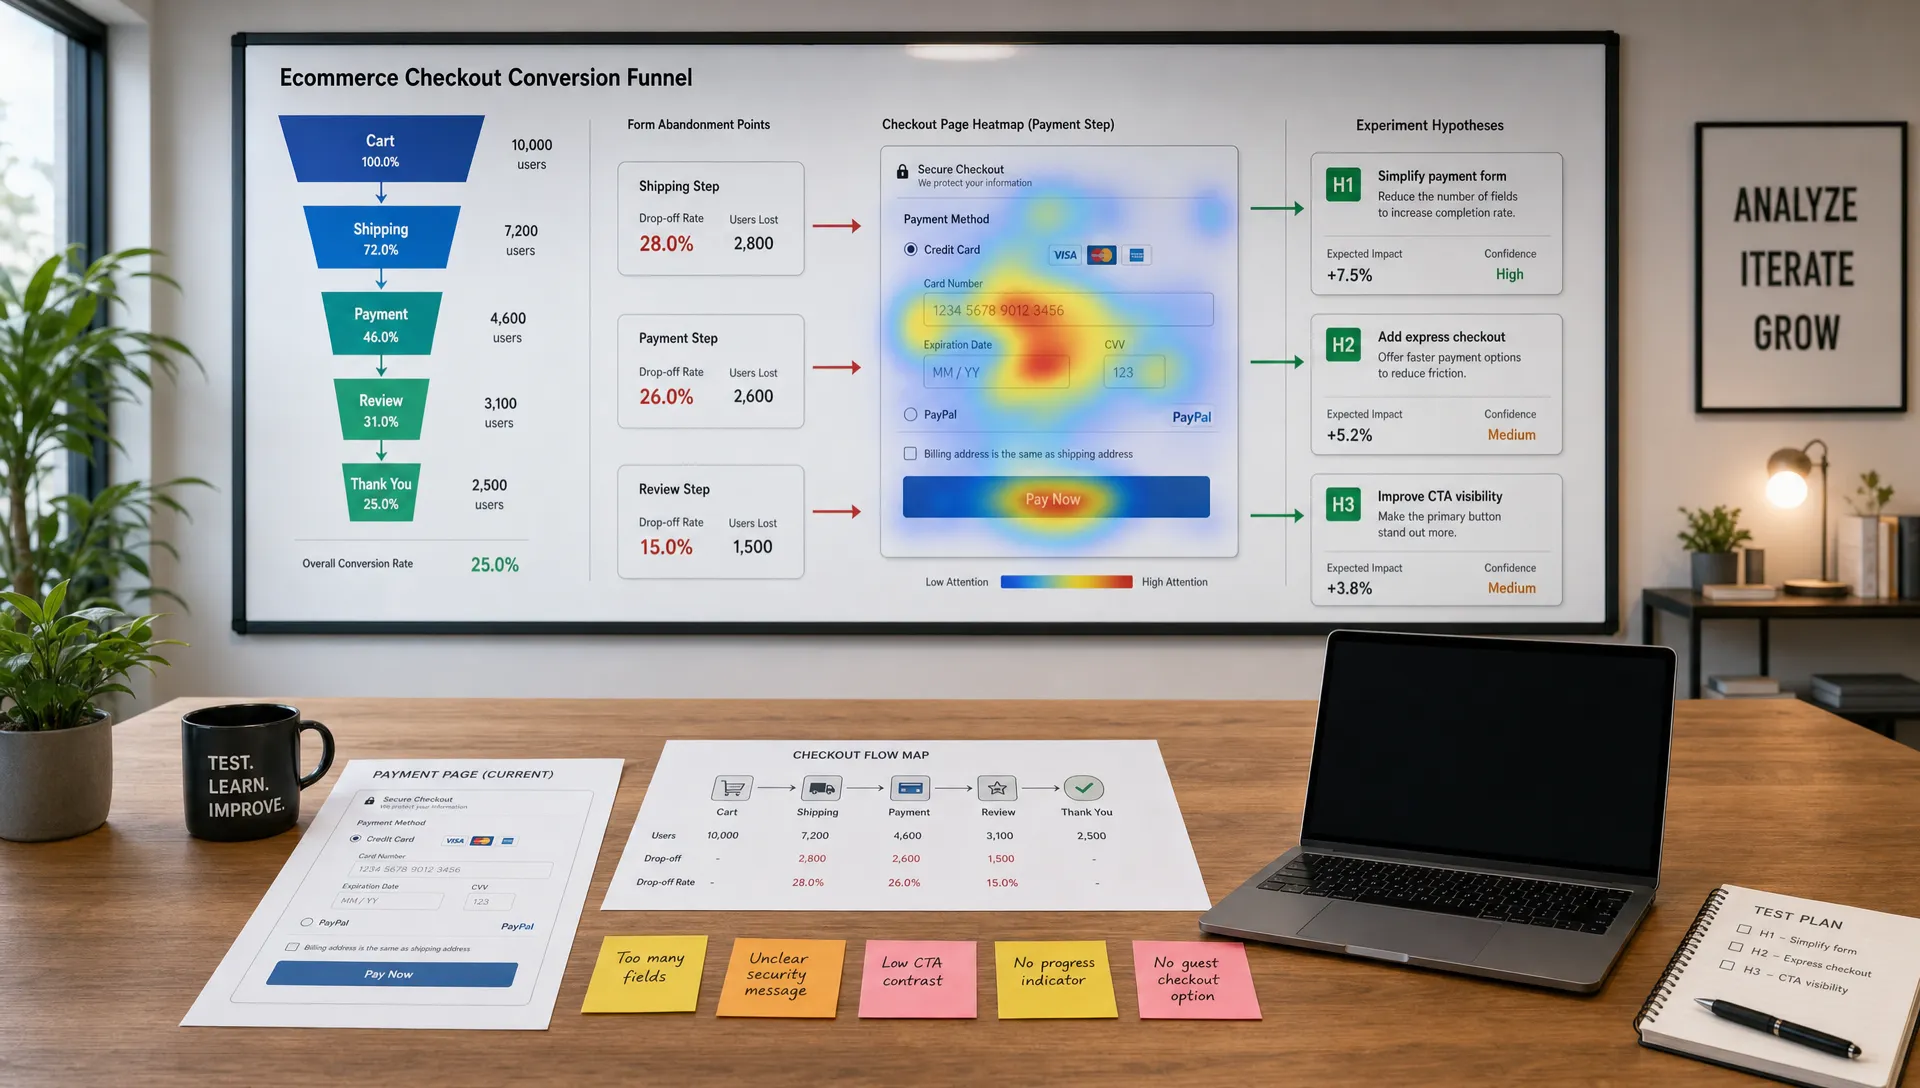
Track conversion rates at each major stage, such as visitor to lead, lead to marketing-qualified lead, marketing-qualified lead to sales-qualified lead, and opportunity to customer. AI may improve one stage while exposing weakness in another.
For instance, AI-generated landing page variants may increase form submissions, but if sales acceptance drops, the copy may be attracting the wrong audience. Measuring only the landing page conversion rate would hide that issue.
Lead quality rate measures the percentage of leads that meet your qualification criteria. This metric is crucial for AI-assisted content creation and automated campaigns because high output can quickly flood a CRM with low-fit prospects.
Define quality based on firmographics, intent signals, engagement behavior, or sales acceptance. Then compare AI-assisted campaigns with manually built campaigns. The goal is not just more leads. The goal is more leads your team can actually convert.
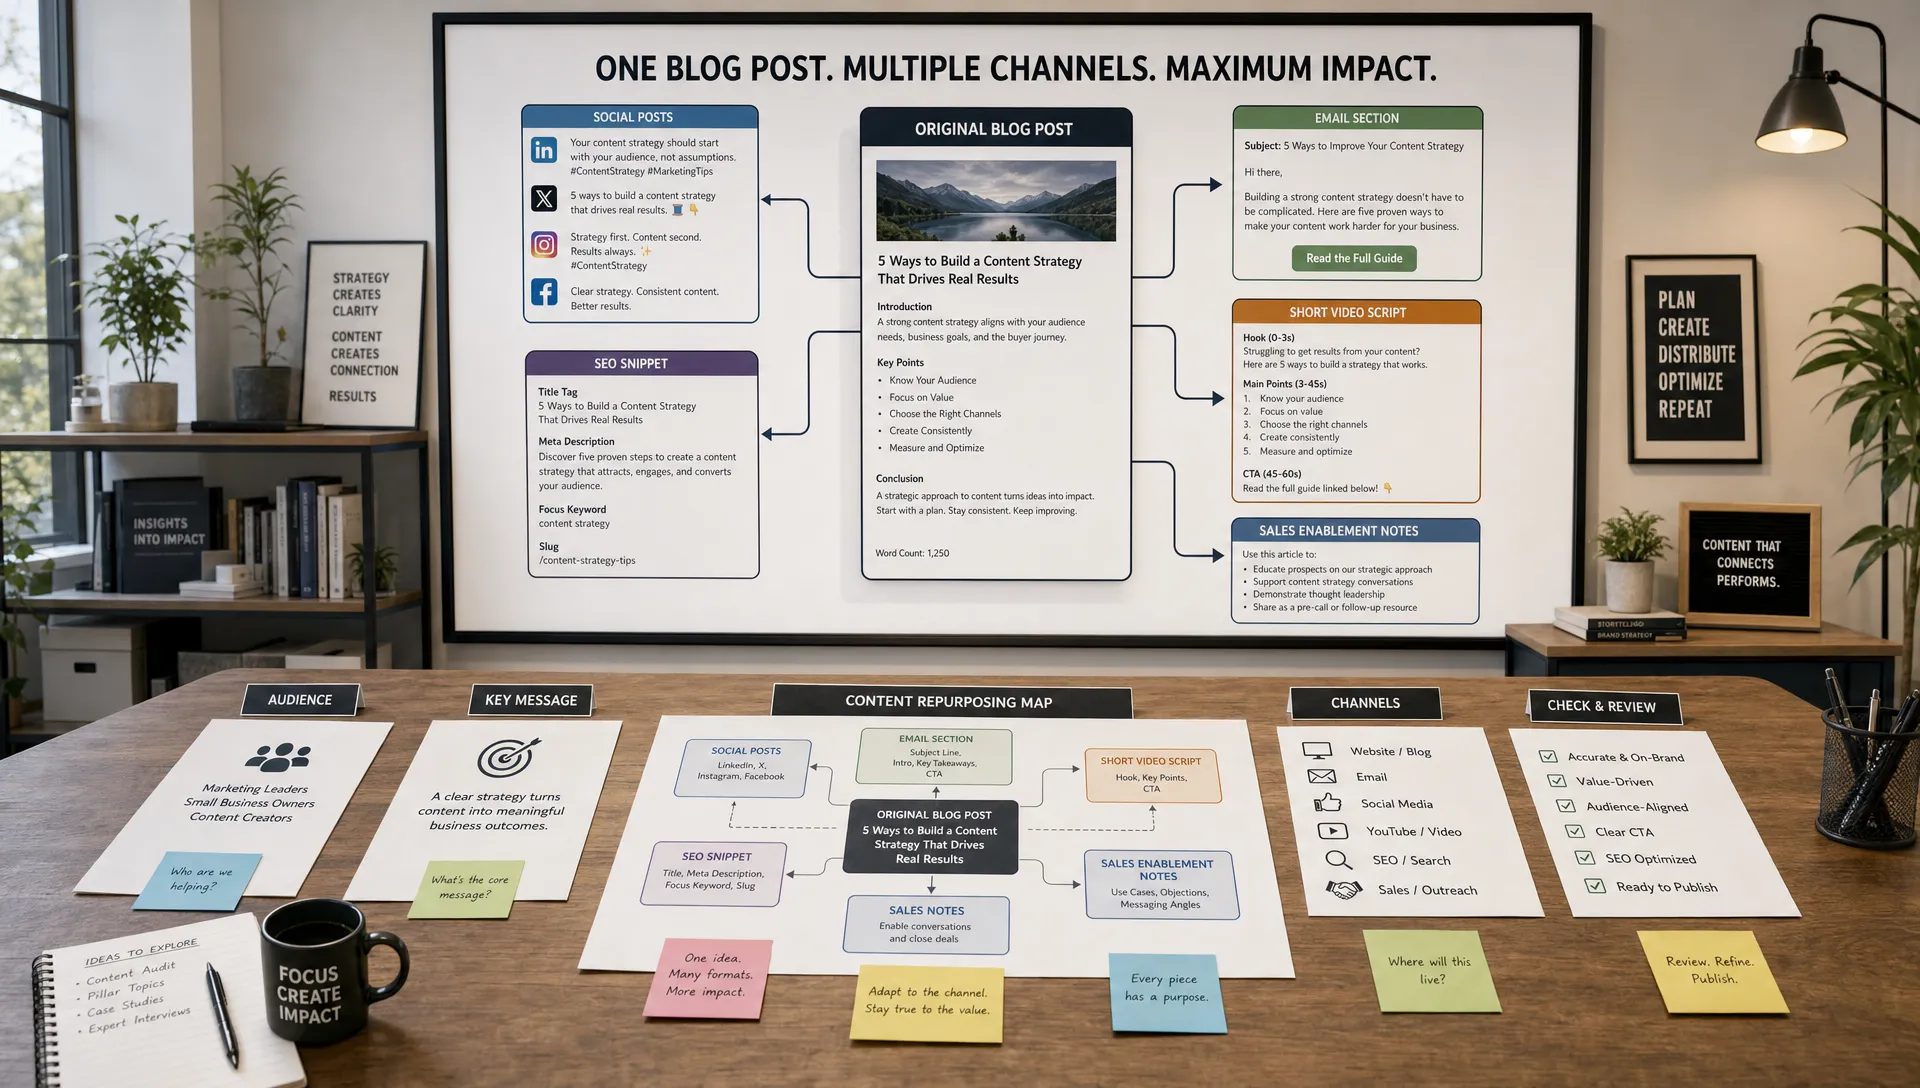
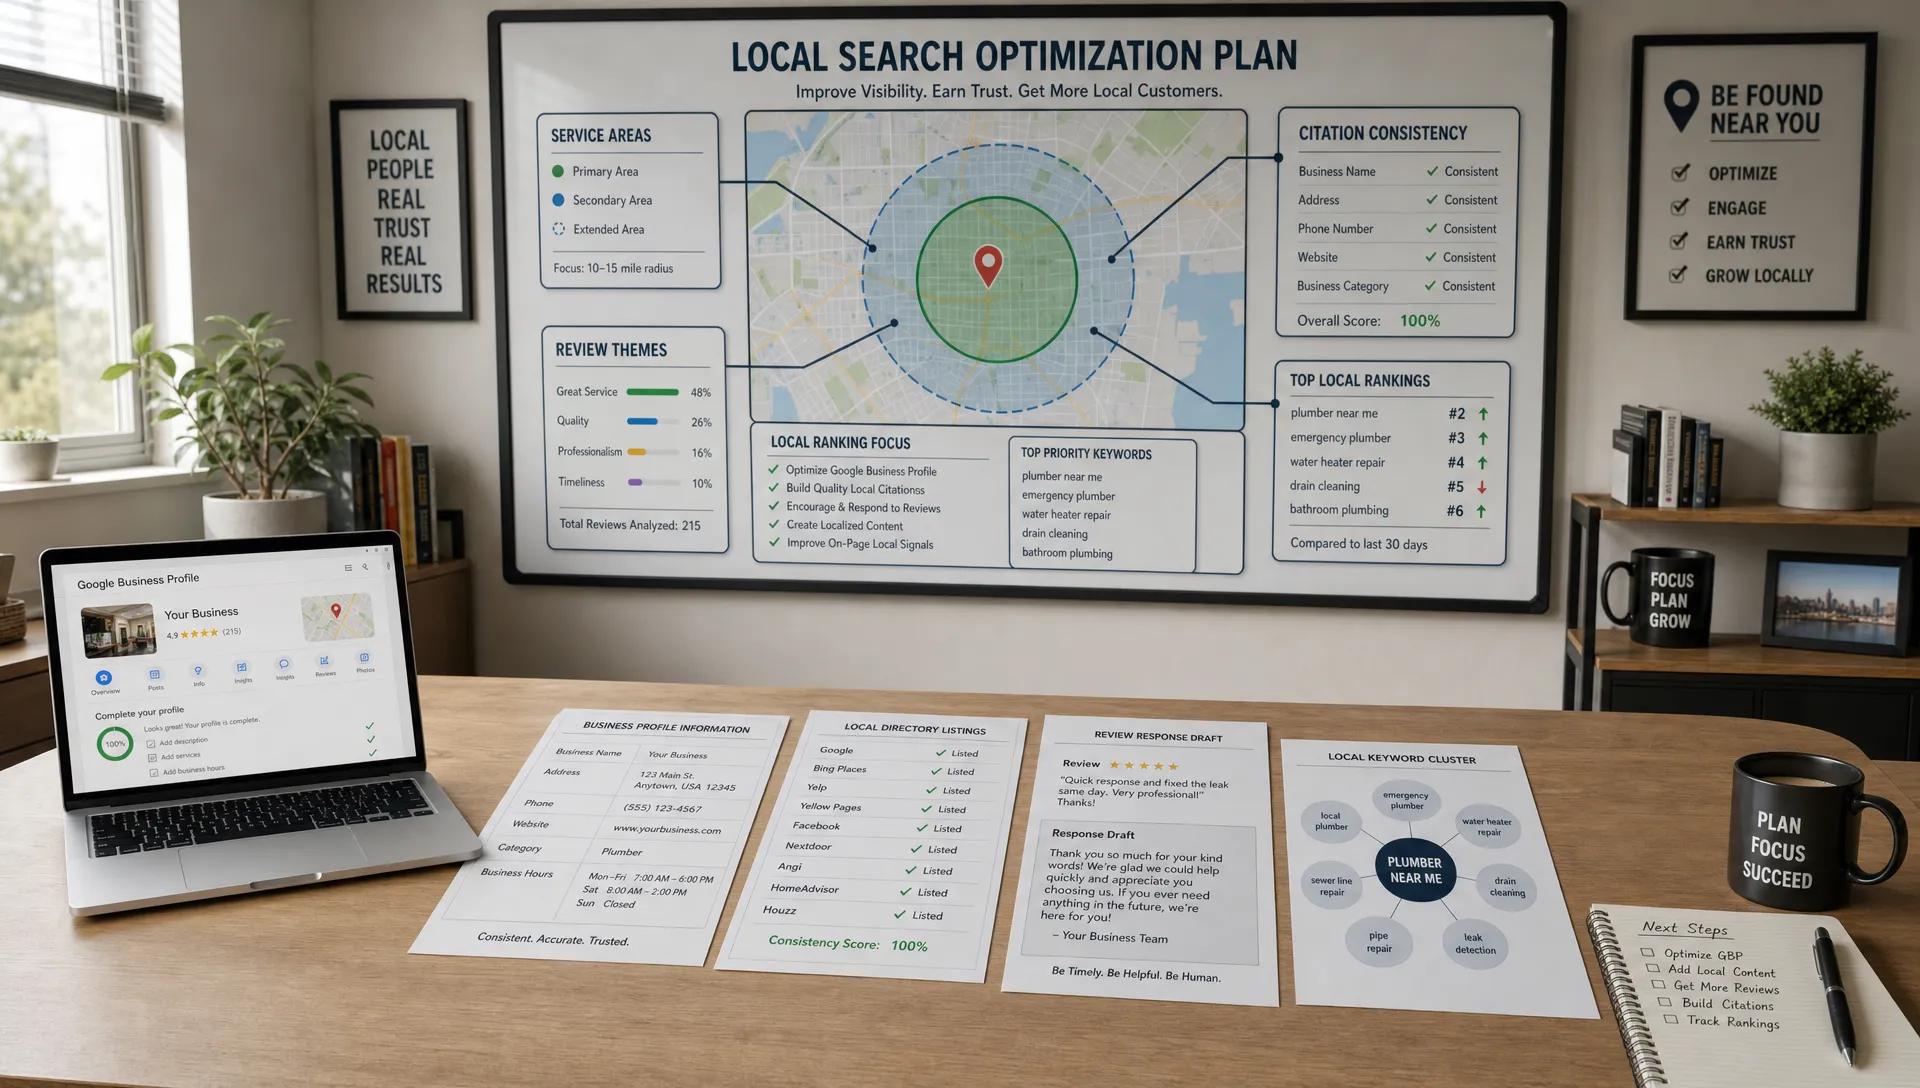
Channel efficiency helps teams understand where AI improves performance by channel. For SEO, this may include organic sessions, keyword visibility, qualified organic leads, and content-assisted conversions. For paid media, it may include cost per qualified lead, return on ad spend, creative fatigue, and budget waste.
If paid campaigns are a major part of your strategy, it is worth pairing these metrics with a deeper understanding of how AI advertising is changing paid media, especially as bidding, creative testing, and audience signals become more automated.
Efficiency is one of the clearest benefits of AI tools, but it must be measured carefully. The strongest teams do not simply ask, “Did AI save time?” They ask, “Did AI save time while maintaining or improving results?”
Time to first draft measures how long it takes to create an initial usable asset, such as an email, blog outline, ad concept, landing page draft, or social post set. This is a practical metric because many marketing teams feel bottlenecks at the drafting stage.
AI can dramatically reduce this time, especially for repetitive formats. But first drafts are not final outputs. Track time saved alongside revision effort and final performance.
Content cycle time measures the total time from idea to publication. It includes research, drafting, editing, compliance review, design, approvals, and publishing.
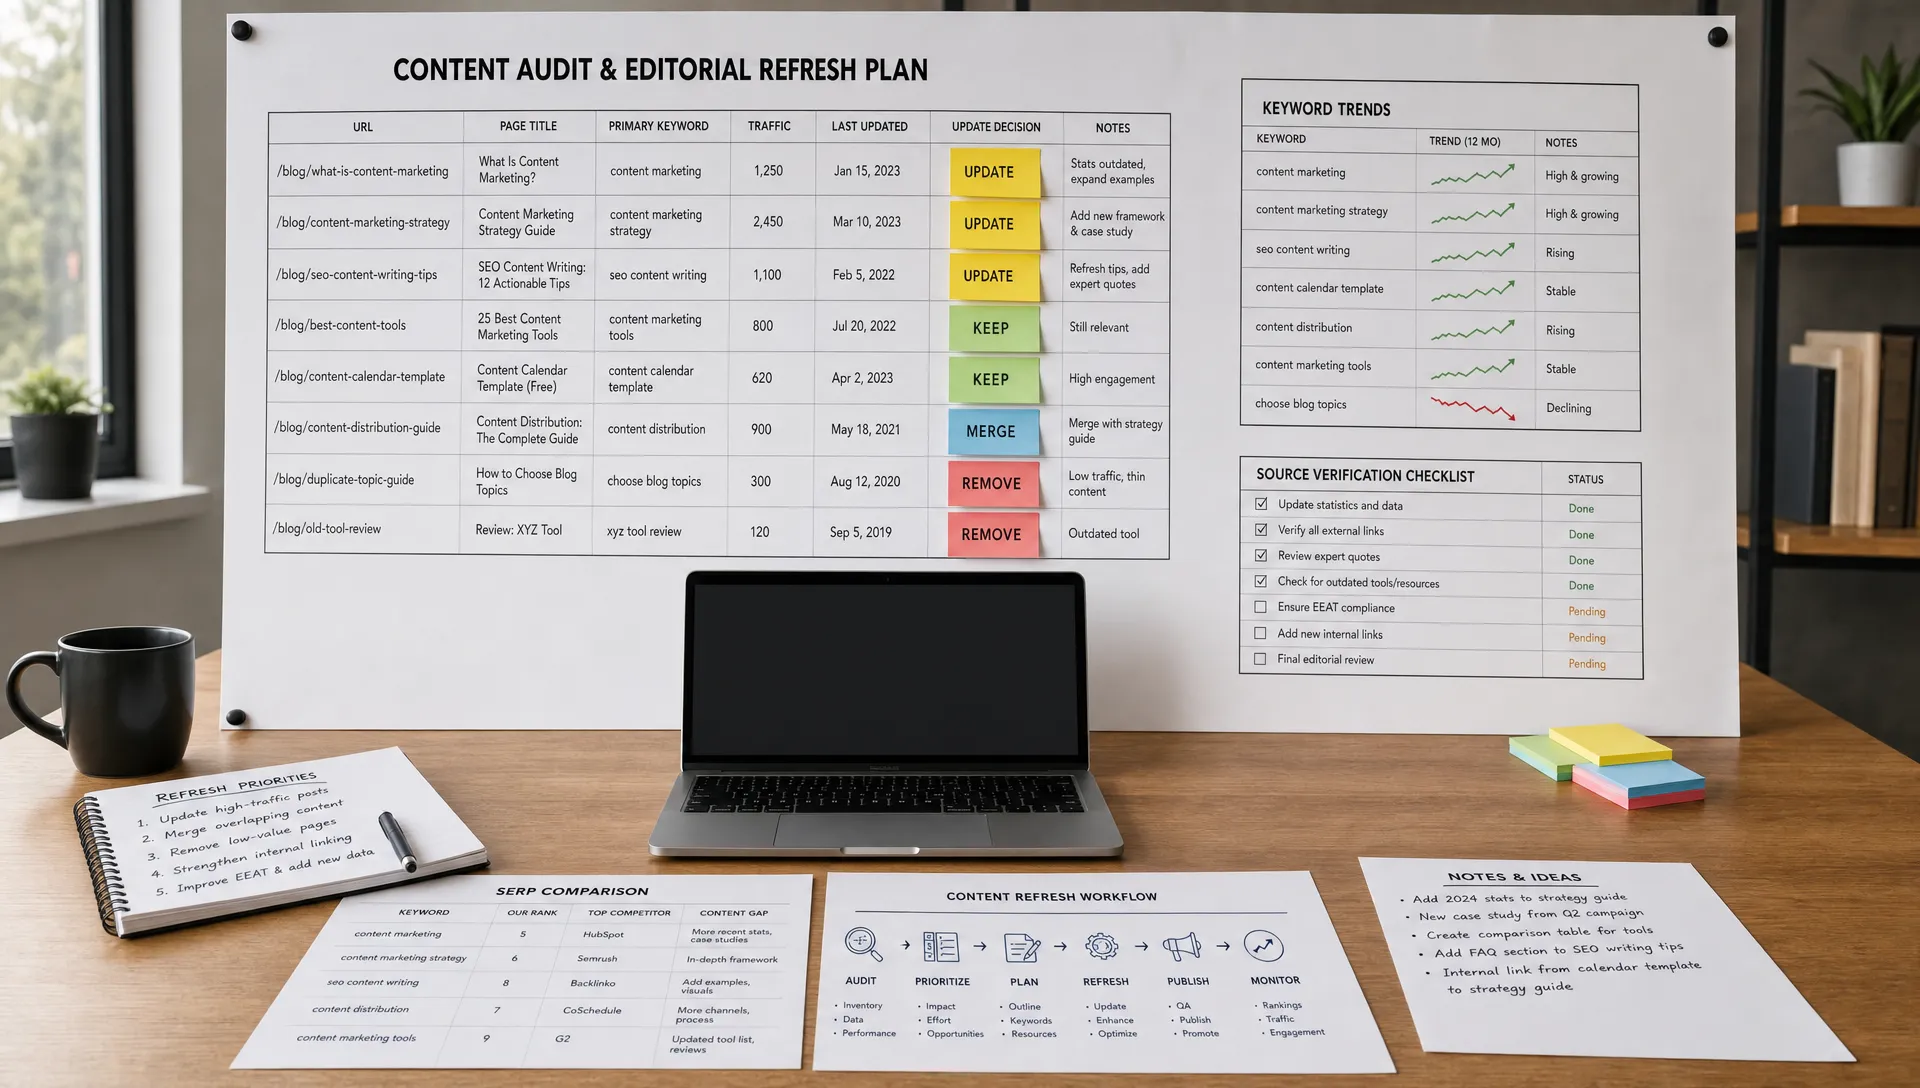
This metric is more valuable than content volume because it reveals workflow friction. If AI reduces drafting time but approvals still take two weeks, the bottleneck has moved rather than disappeared. Teams using AI for content should look beyond production speed and evaluate the full workflow, as covered in this guide to how AI for content creation saves time and scales output.
Cost per asset estimates the total cost required to produce a marketing asset. Include team time, freelancers, software, editing, design, and review. AI can reduce this cost, but only when the final asset meets quality standards.
This metric is useful for comparing formats. You may find that AI creates the biggest savings in email variations, ad copy testing, and content repurposing, while expert-led thought leadership still requires deeper human input.
Automation coverage measures the percentage of a workflow handled by approved automation. For example, an email campaign workflow might include audience segmentation, draft generation, QA checks, scheduling, and reporting.
The goal is not 100 percent automation. The goal is appropriate automation. High-risk tasks, such as legal claims, medical content, financial recommendations, or sensitive customer messaging, may require more human oversight.
AI-assisted campaigns can move quickly, but speed creates risk when quality controls are weak. Quality metrics protect trust, brand consistency, and long-term performance.
Human revision rate measures how much editing is required before an AI-assisted asset is approved. This can be tracked simply as light, moderate, or heavy revision, or more precisely by edit time.
A high revision rate may signal weak prompts, poor source material, unclear brand guidelines, or the wrong tool for the task. A declining revision rate over time usually means your team is improving its AI workflows.
QA pass rate measures the percentage of AI-assisted assets that pass review on the first submission. Your QA checklist might include factual accuracy, brand voice, offer clarity, grammar, compliance requirements, and formatting.
This metric is especially important for teams scaling content across industries or product lines. It gives managers a way to improve process quality without manually inspecting every asset in detail.
Brand voice consistency measures how closely AI-assisted content matches your company’s tone, positioning, and messaging standards. This can be reviewed manually or supported by scoring rubrics.
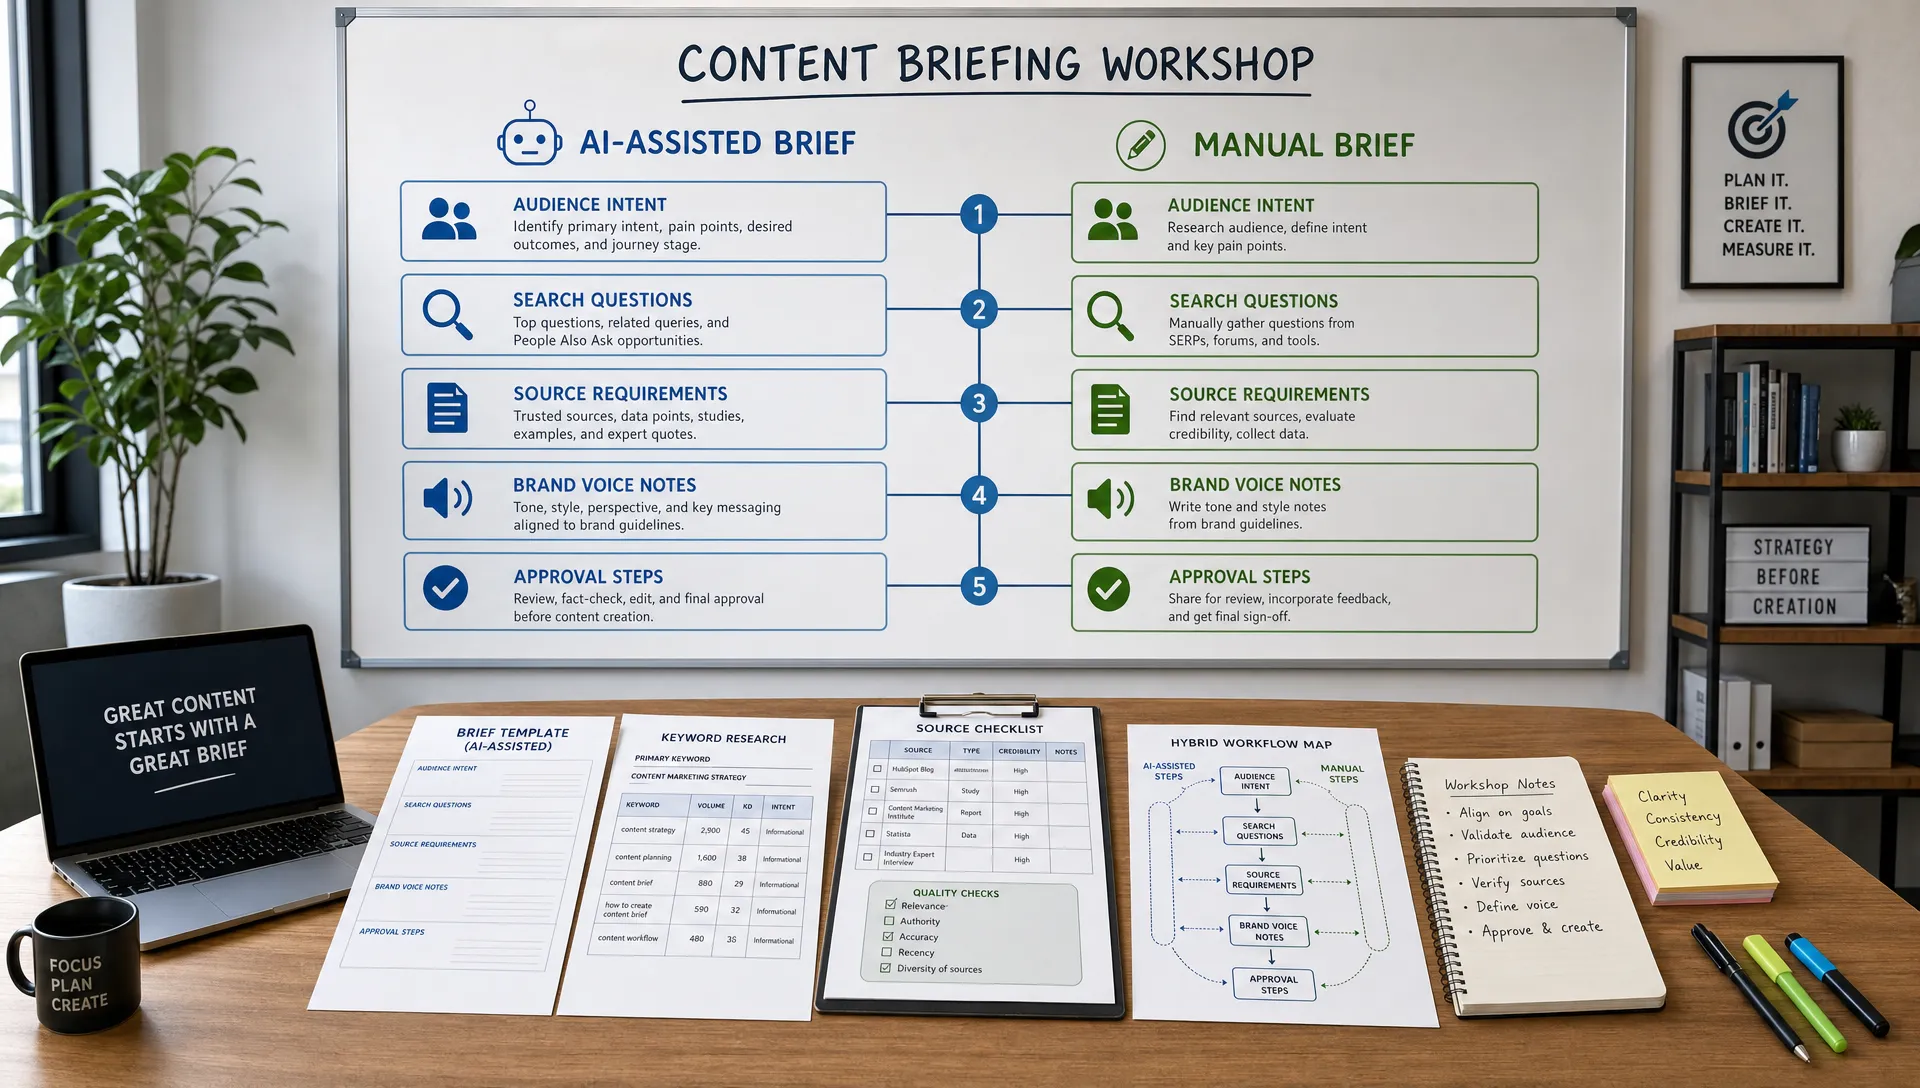
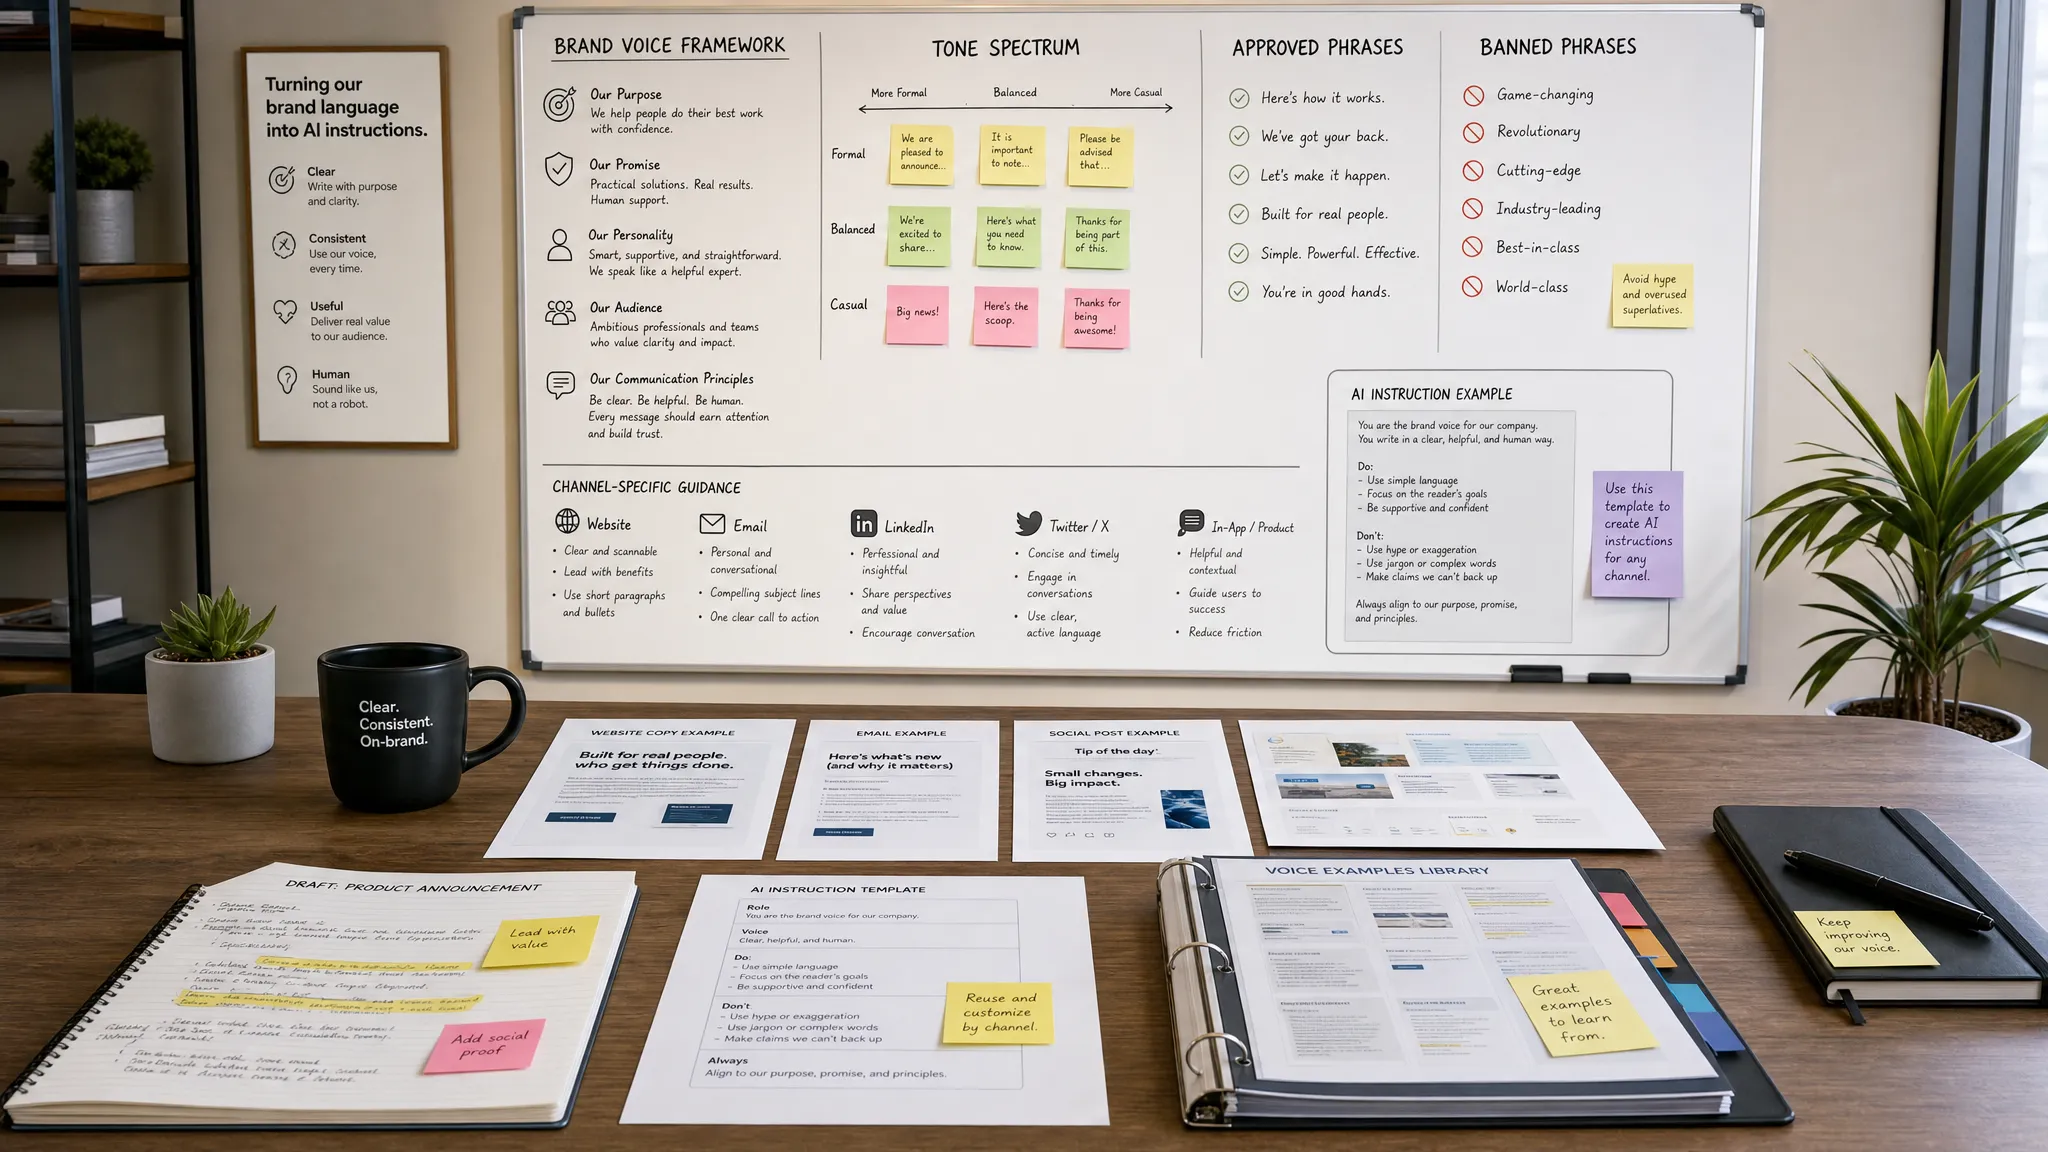
The best approach is to define what “on brand” means before measuring it. Create examples of approved language, banned phrases, tone rules, and positioning principles. If this is a current challenge, start with the fundamentals of using AI for marketing without losing your brand voice.
Factual accuracy rate tracks how often AI-assisted content contains errors, unsupported claims, outdated information, or misleading statements. This is a critical metric for any team publishing educational, technical, legal, financial, health, or product-related content.
Use source requirements for claims, assign review responsibility, and track recurring error types. If errors keep appearing in the same category, improve your source library, prompts, or approval process.
Risk flag rate measures how often AI-assisted outputs trigger legal, compliance, privacy, or brand concerns. This does not mean AI is unsafe. It means your team is watching the right signals.
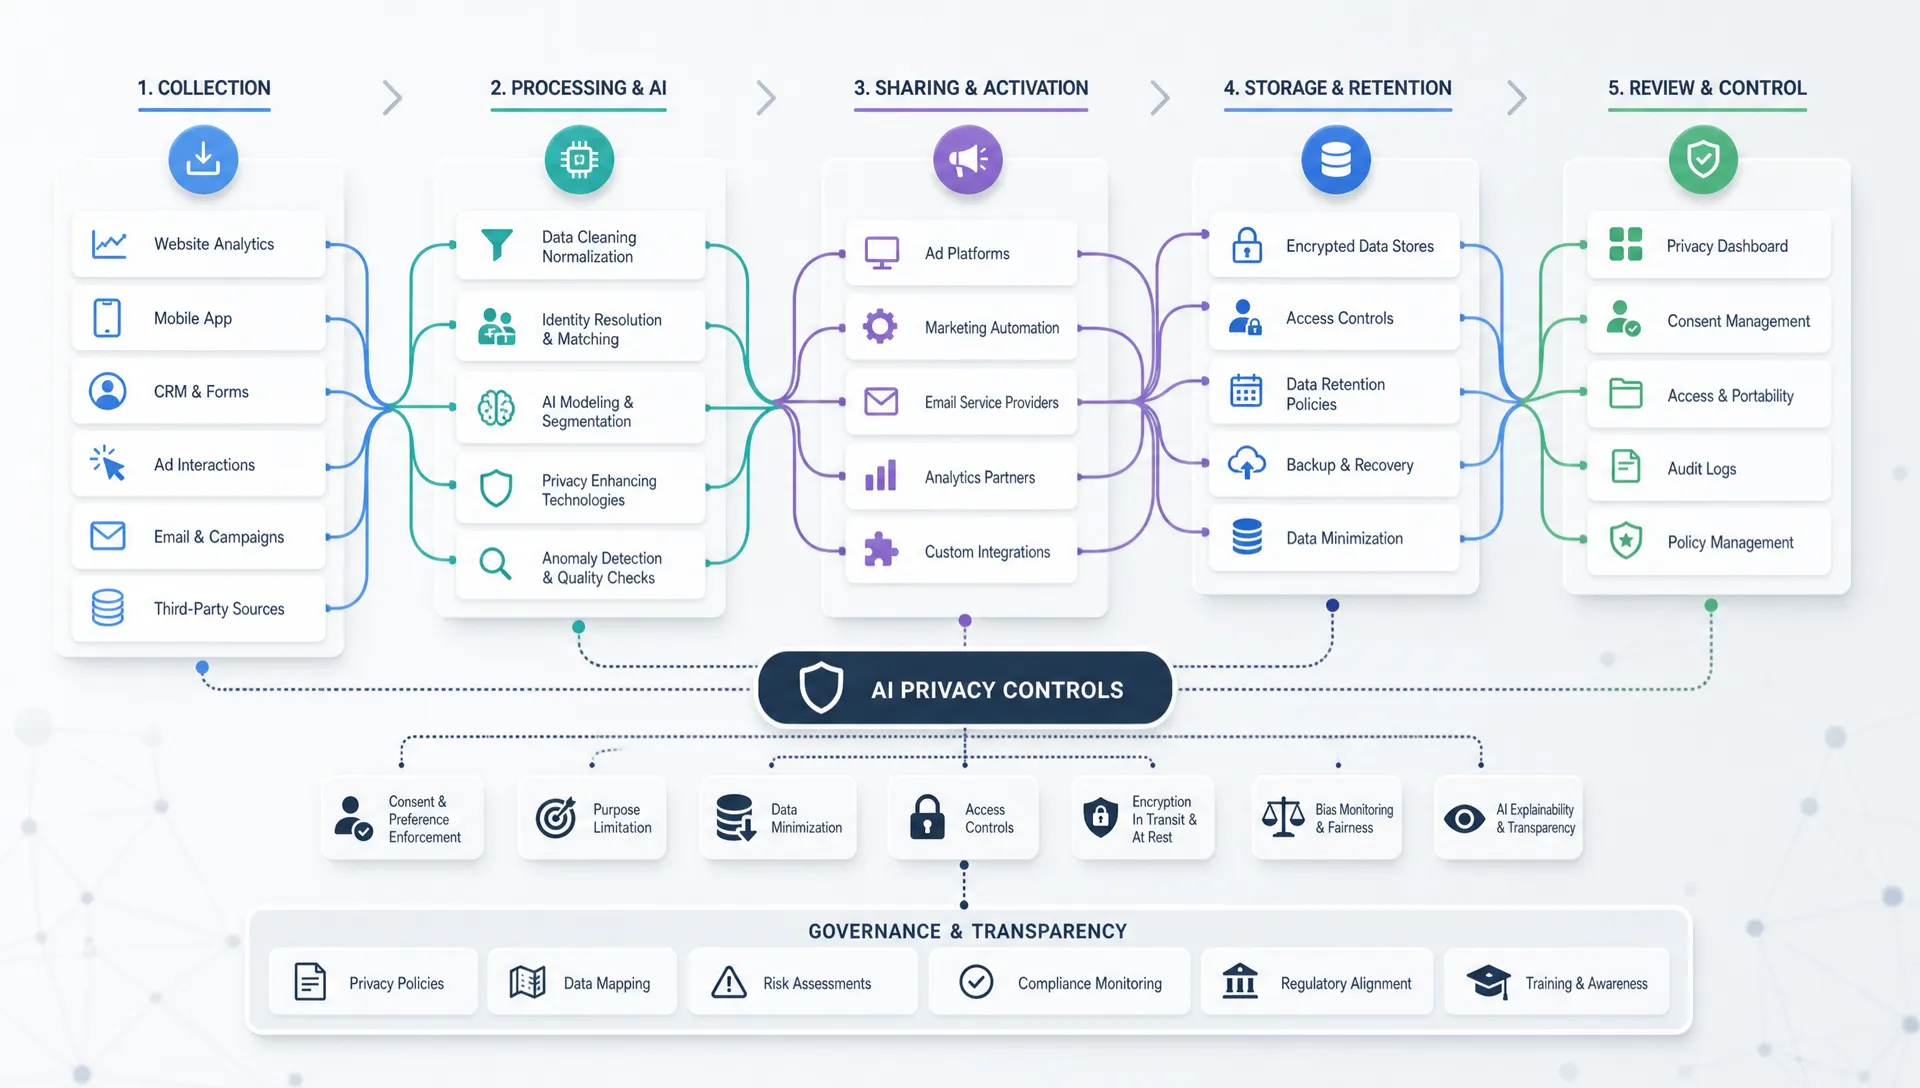
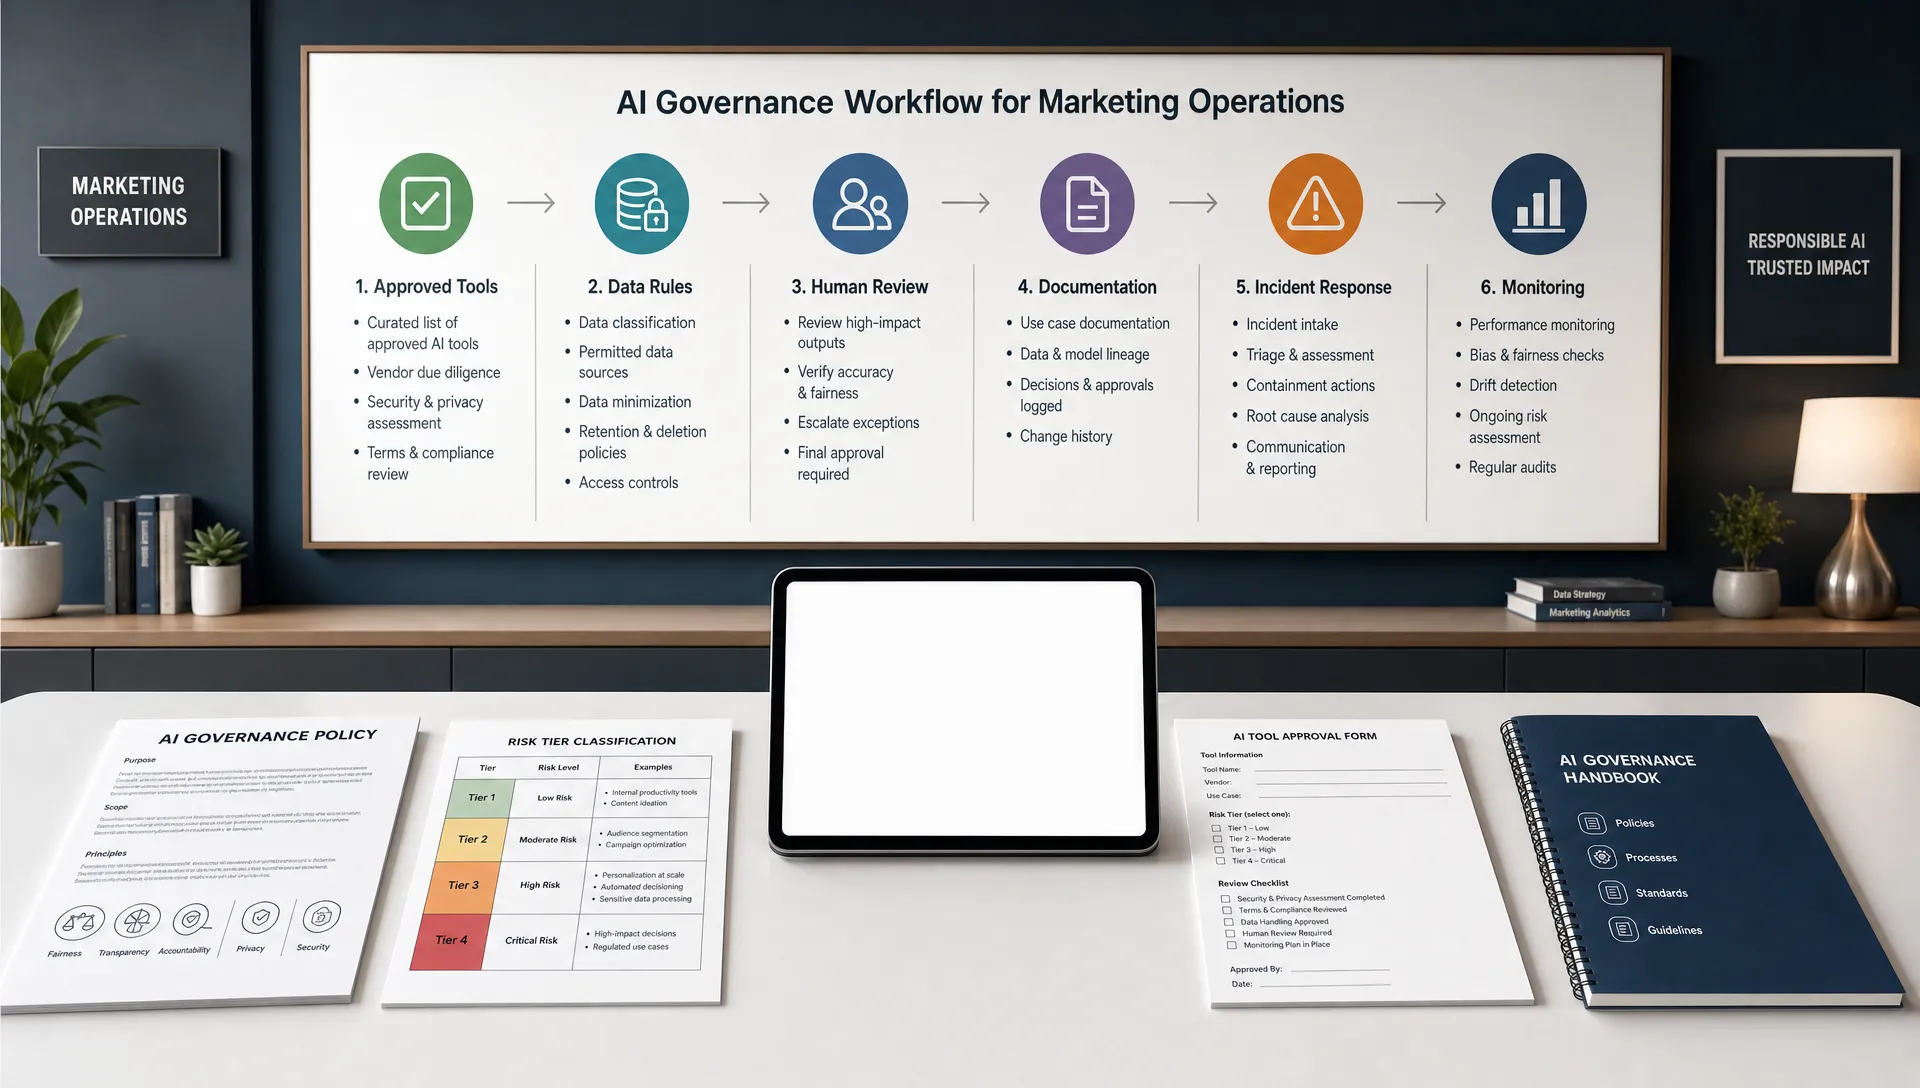
The NIST AI Risk Management Framework emphasizes the importance of mapping, measuring, managing, and governing AI risks. Marketing teams can apply that principle by documenting where AI is used, what risks exist, and which controls are required before publication.
AI only creates value when people actually use it in the right workflows. Adoption metrics help leaders understand whether tools are embedded into daily work or sitting unused after launch.
Active user rate measures the percentage of team members using approved AI tools within a defined time period. This can be tracked weekly or monthly, depending on your team size.
Do not treat adoption as a vanity metric. High usage is only good when it supports approved workflows. Pair active user rate with quality, efficiency, and outcome metrics.
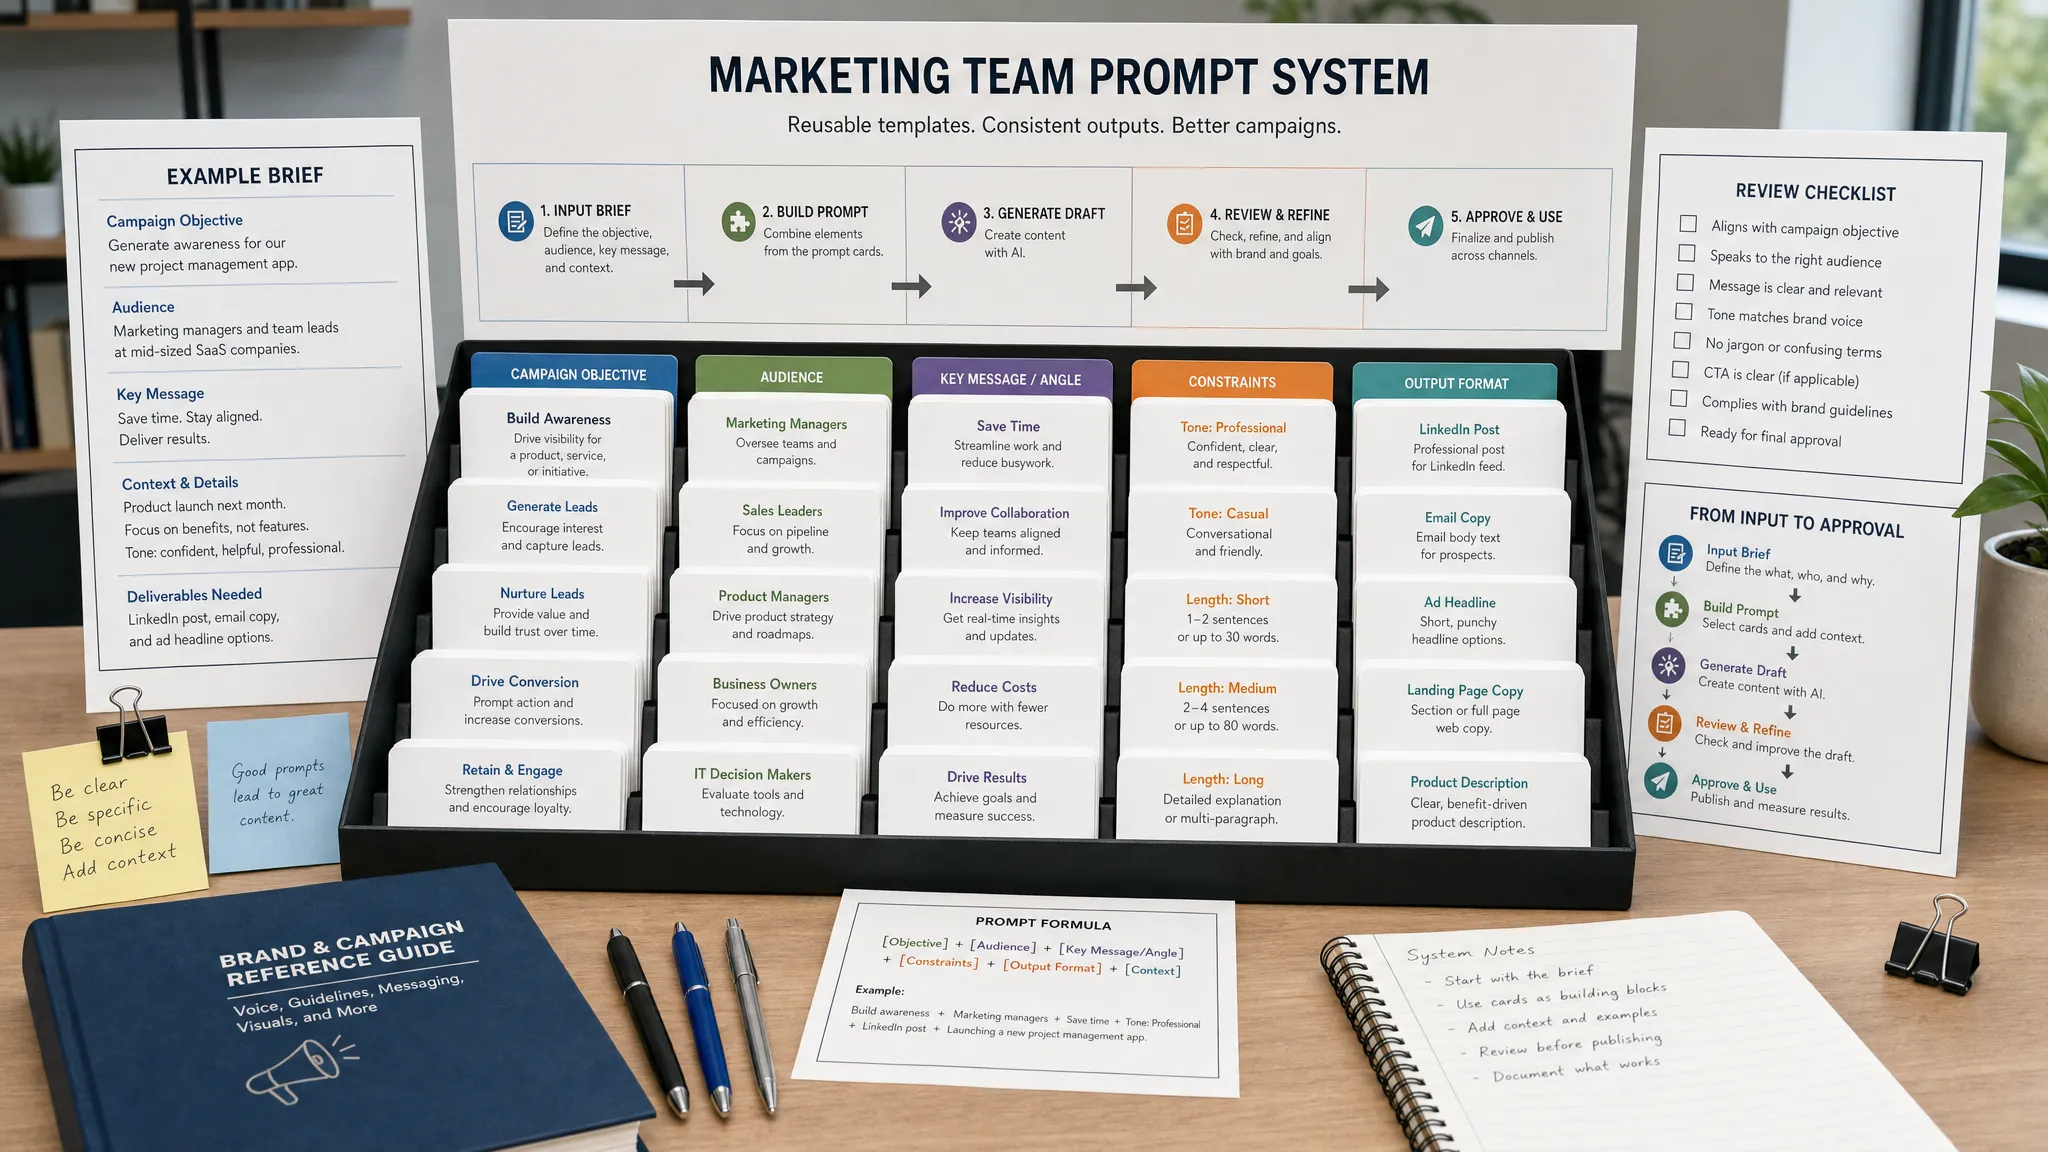
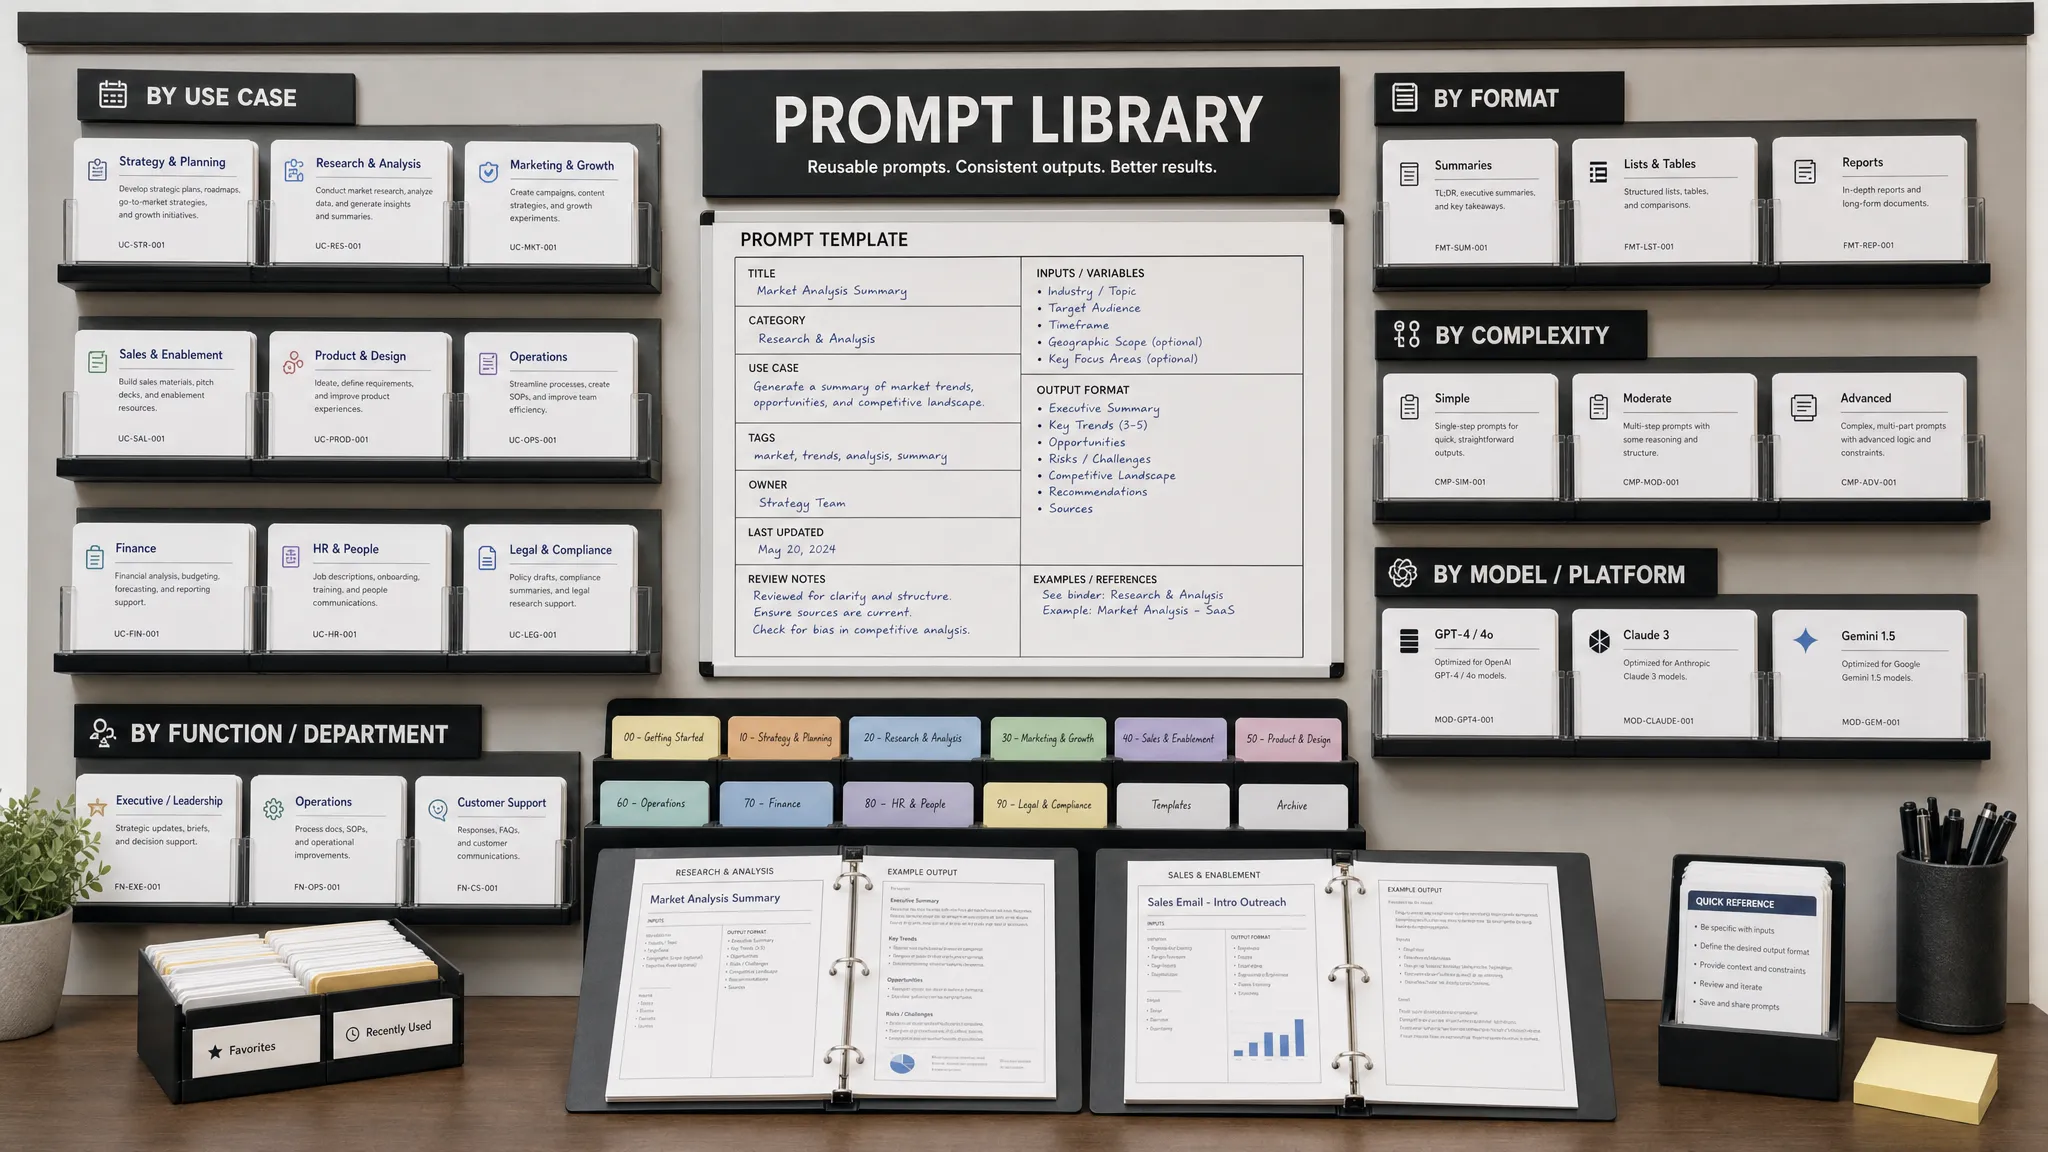
Prompt reuse rate measures how often team members use approved prompts or templates instead of starting from scratch. This is useful because repeatable prompts improve consistency, reduce errors, and make training easier.
A low prompt reuse rate may mean your prompt library is hard to find, too generic, or not aligned with real tasks. A high reuse rate can indicate that your team has standardized best practices.
Workflow completion rate measures how often an AI-assisted process reaches the intended outcome without manual rescue. For example, if an automated reporting workflow frequently requires manual data cleanup, the workflow is not truly efficient.
Track where breakdowns happen. Common failure points include missing data, unclear approval rules, poor integrations, duplicate records, and inconsistent campaign naming.
Training impact measures whether AI enablement actually improves performance. Compare metrics before and after training, such as revision rate, time to first draft, QA pass rate, or campaign setup time.
This metric helps prove whether education is translating into better execution. It also shows which teams need more support.
AI-powered analytics are only as useful as the data behind them. If campaign data is incomplete, inconsistent, or poorly governed, AI can amplify confusion instead of creating clarity.
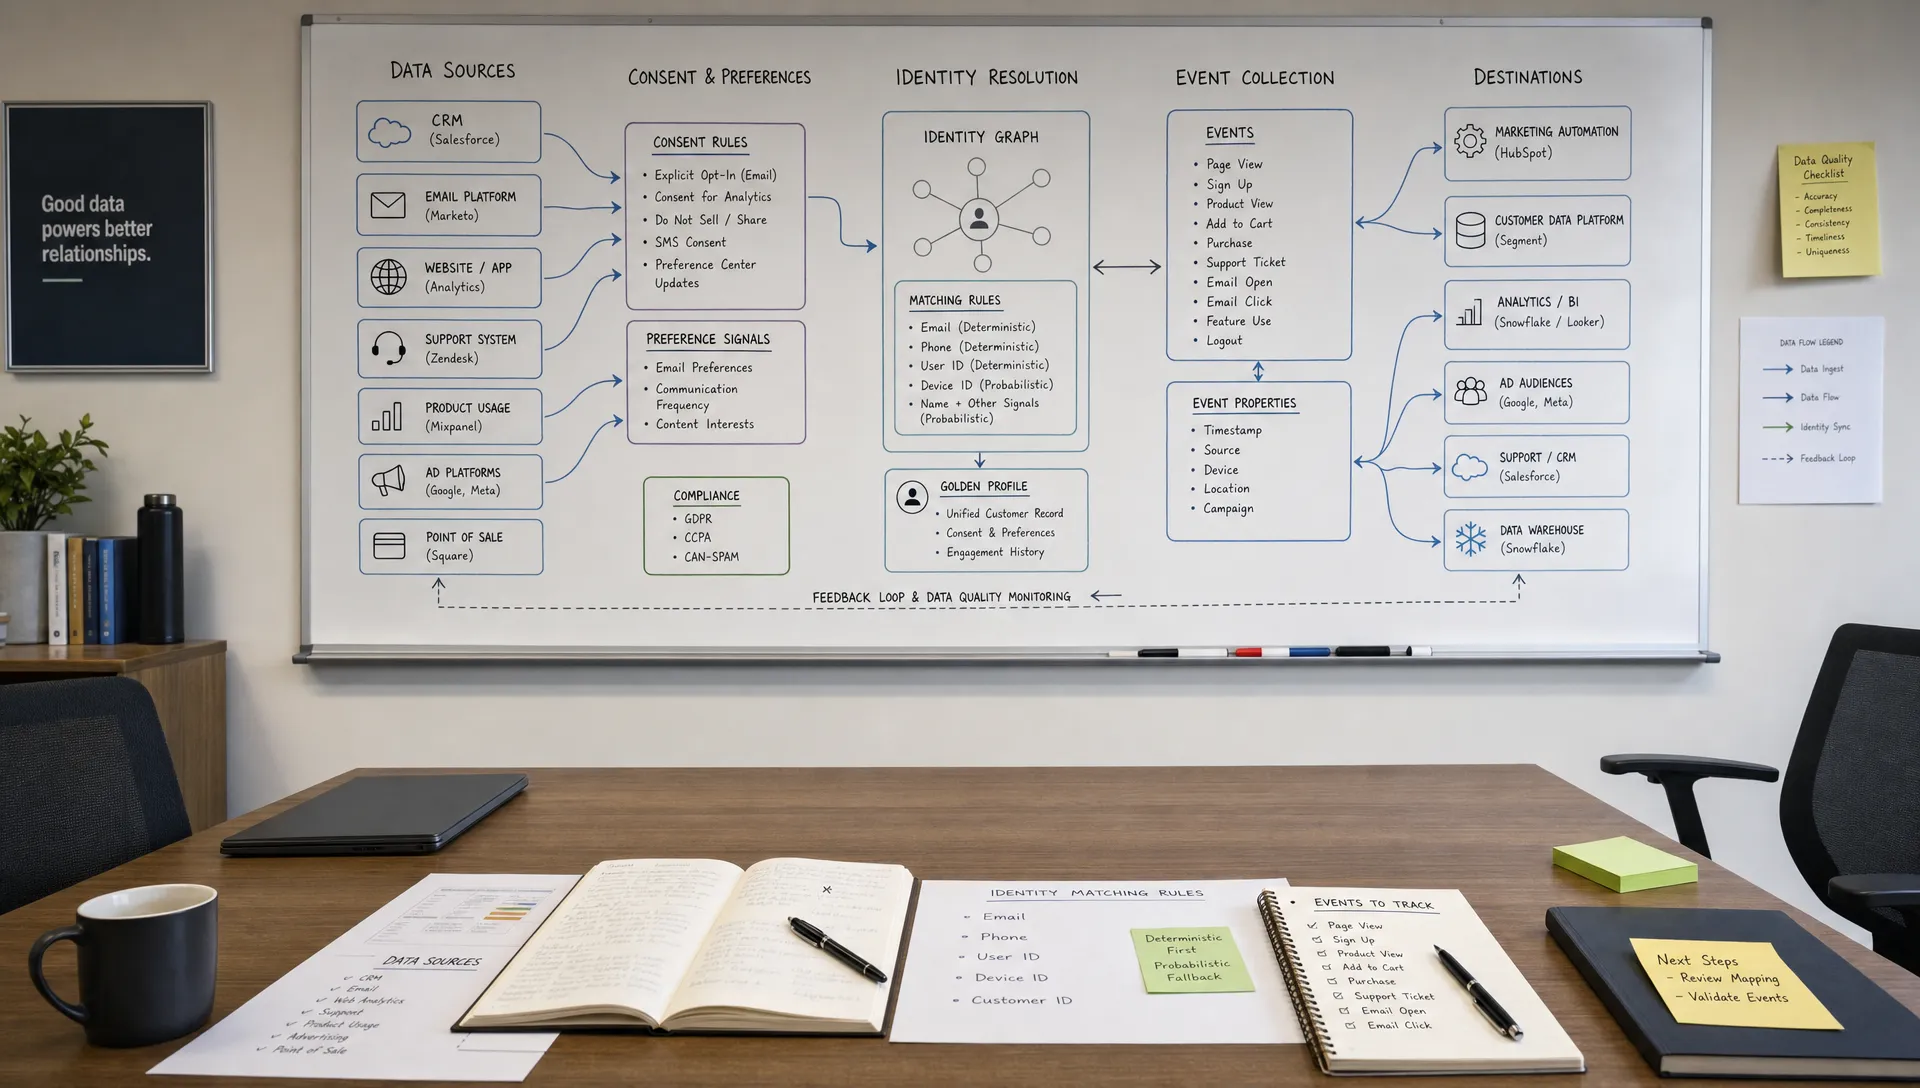
Data completeness measures whether required fields are populated across your CRM, analytics platform, ad accounts, and marketing automation tools. Missing source data, campaign names, lifecycle stages, or revenue fields can weaken attribution and reporting.
Set minimum data standards for campaign launches. For example, every campaign should have a consistent naming convention, audience label, objective, owner, and tracking parameters.
Attribution confidence is a practical rating that shows how much trust your team should place in a performance report. Not every campaign can be measured perfectly, especially when journeys span multiple channels and devices.
Instead of pretending attribution is exact, label confidence levels. A campaign with clean tracking, CRM connection, and sufficient volume may have high confidence. A campaign with missing UTM data and small sample size may have low confidence.
Data latency measures how long it takes for performance data to become available and usable. This matters because AI-driven optimization often depends on fast feedback.
If campaign data arrives too late, your team may miss the best window to adjust budgets, refresh creative, or fix underperforming segments.
AI gives marketers the ability to test more ideas, but more tests are not always better. Experimentation metrics help teams learn faster without creating noise.
Test velocity measures how many meaningful experiments your team runs in a given period. A meaningful experiment has a clear hypothesis, defined audience, success metric, and decision rule.
Examples include testing AI-assisted subject lines against human-written subject lines, comparing personalized landing page copy by segment, or evaluating different ad creative concepts.
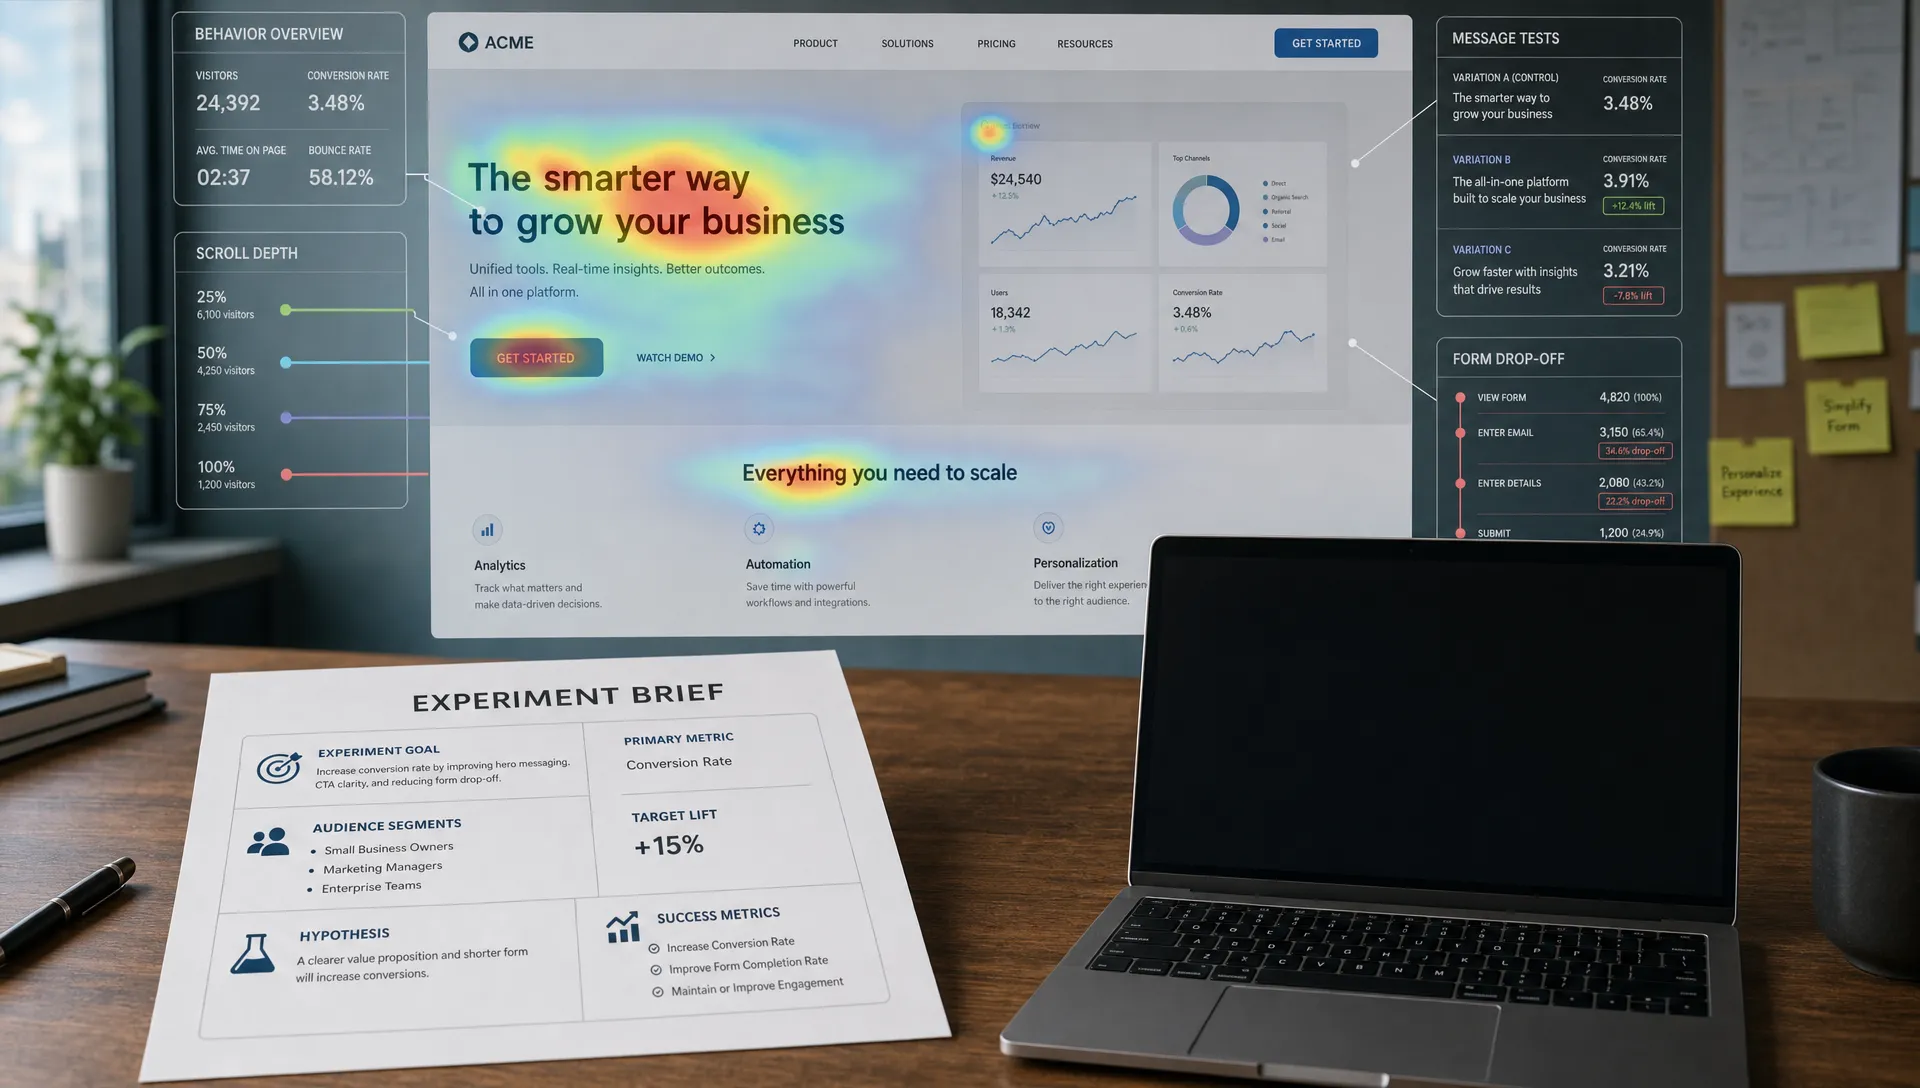
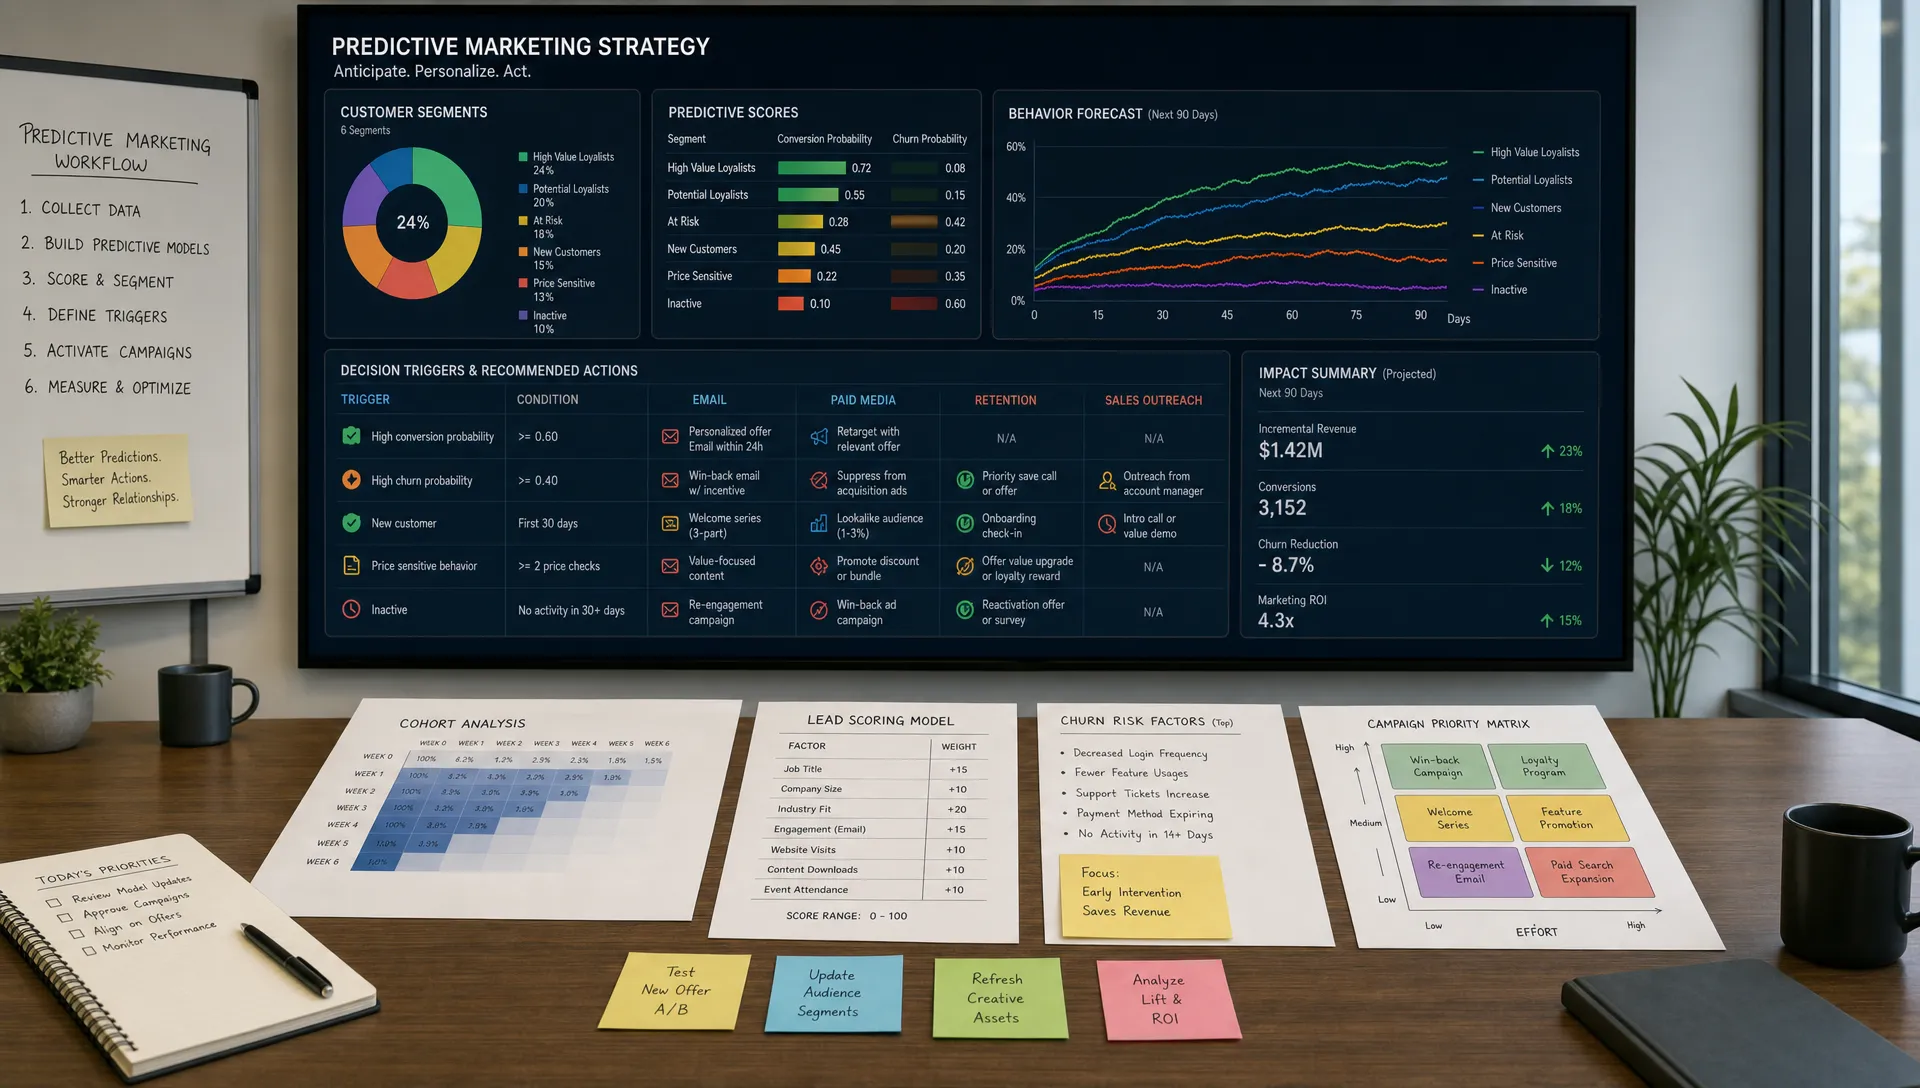
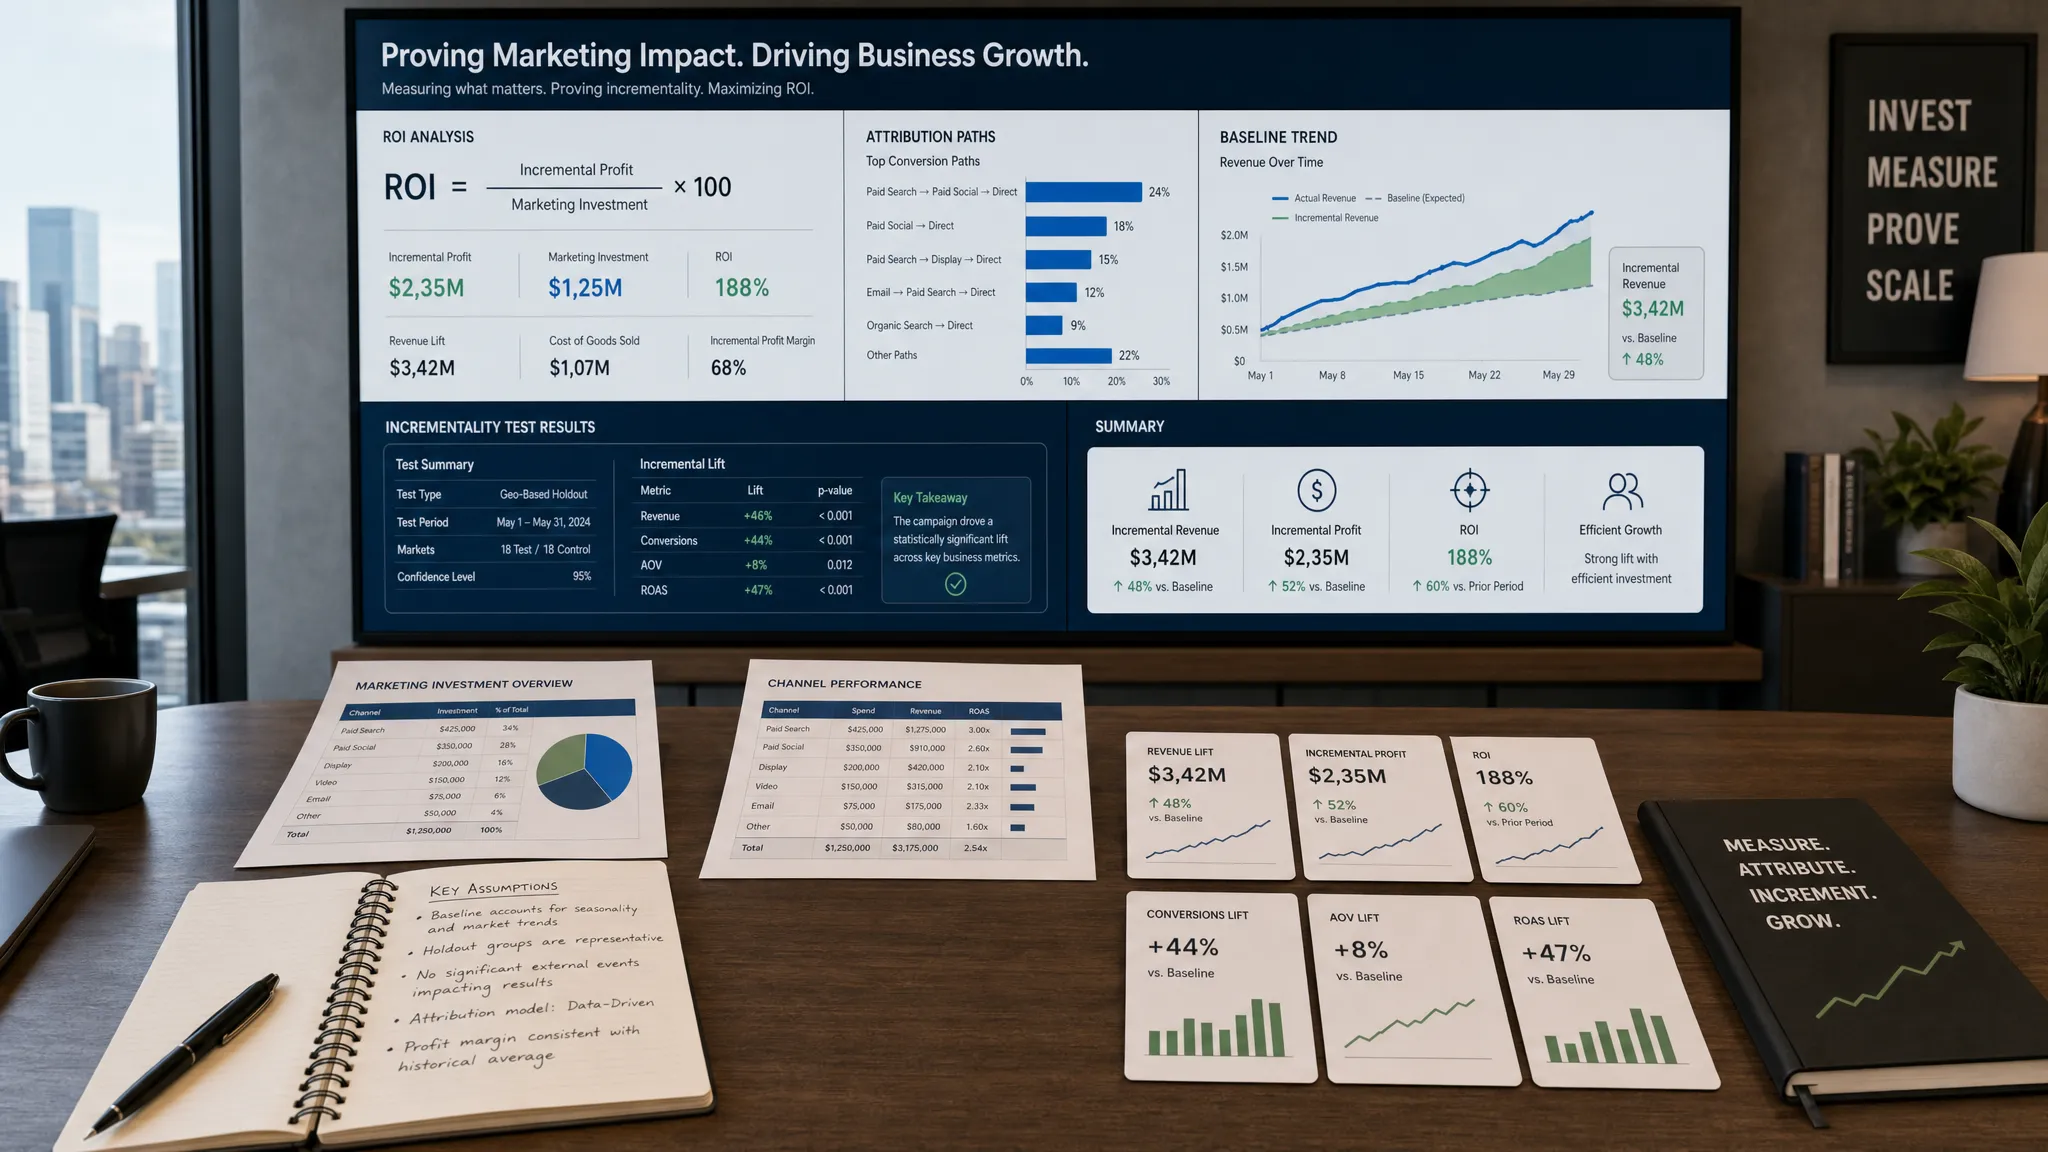
Incremental lift measures the performance improvement caused by a change, not just the performance of the campaign overall. This is important because AI-assisted campaigns may appear successful due to seasonality, budget increases, or audience differences.
Whenever possible, use holdouts, A/B tests, or matched comparisons. The goal is to isolate what AI actually improved.
Learning-to-action rate measures how often experiment insights lead to real changes. Many teams run tests, document results, and then fail to apply what they learned.
Track whether winning messages become part of future campaigns, whether failed prompts are retired, and whether successful workflows are added to your standard operating procedures.
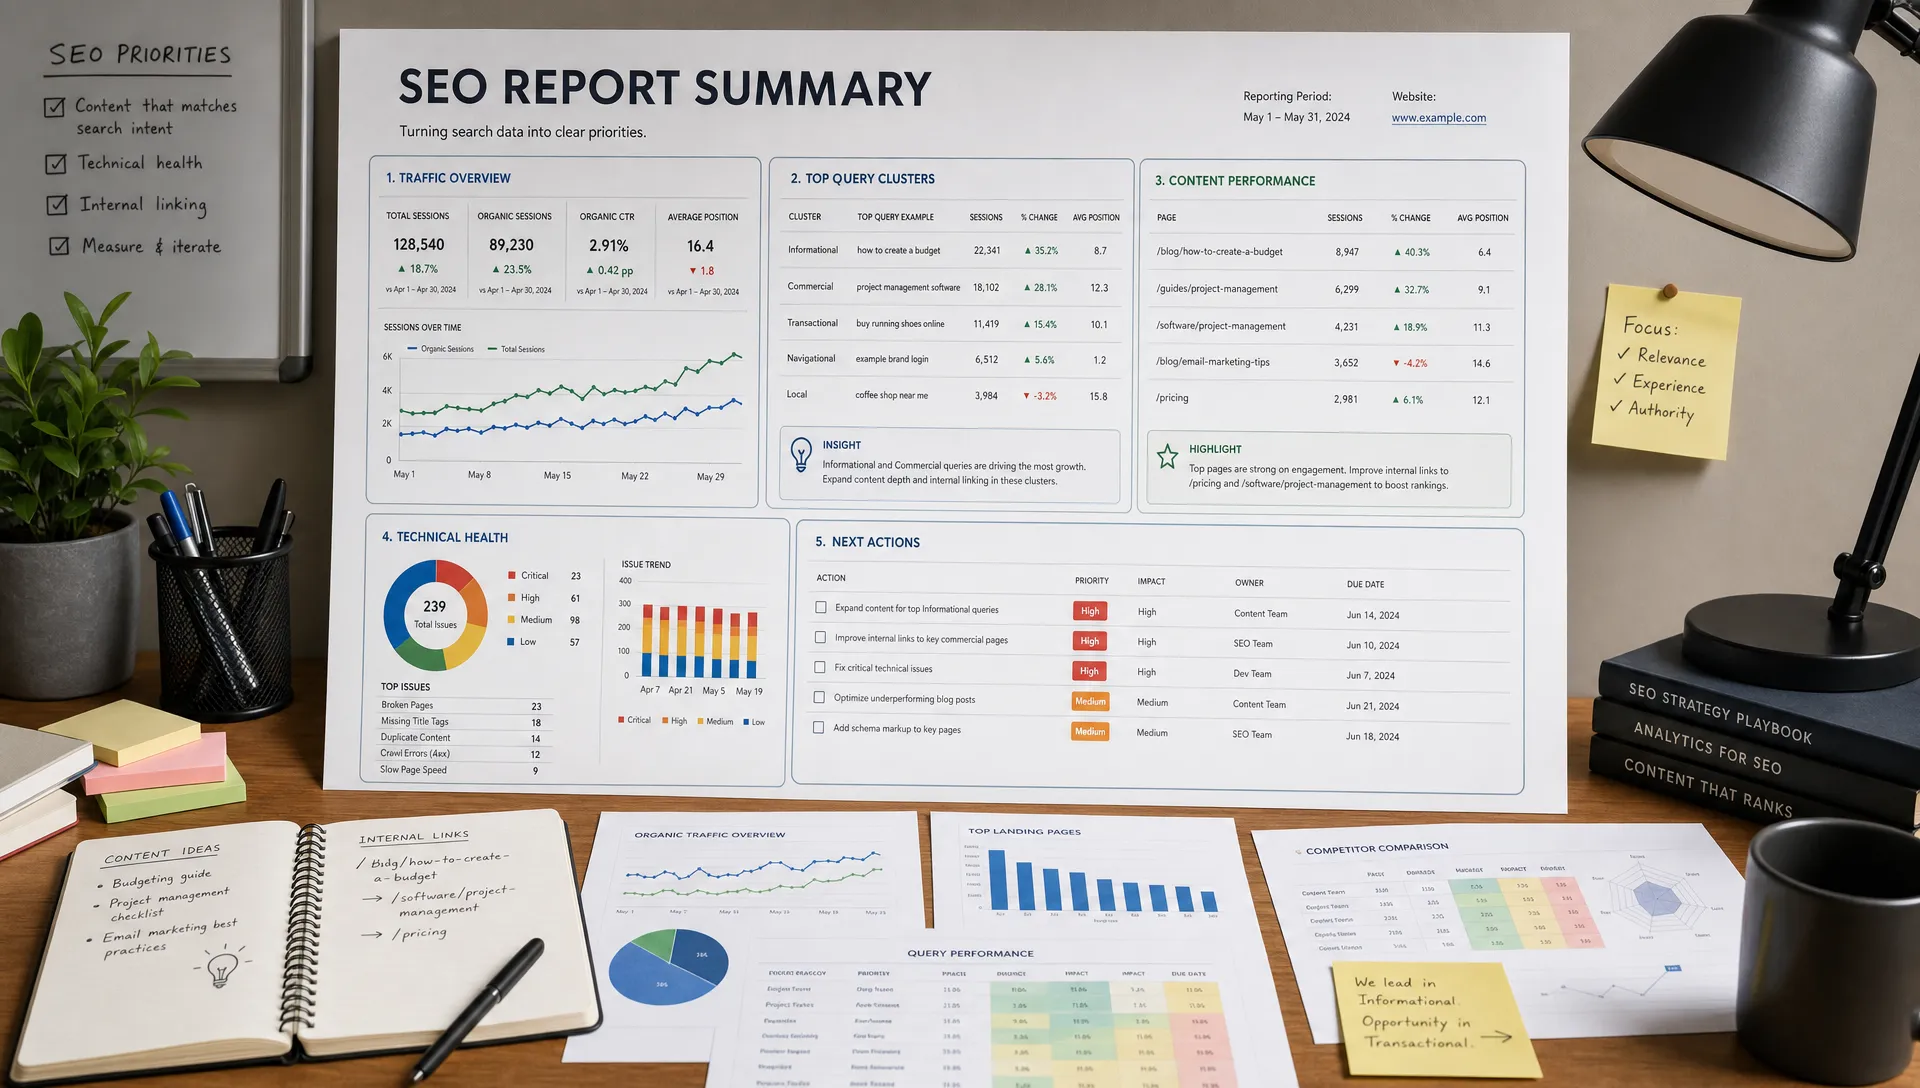
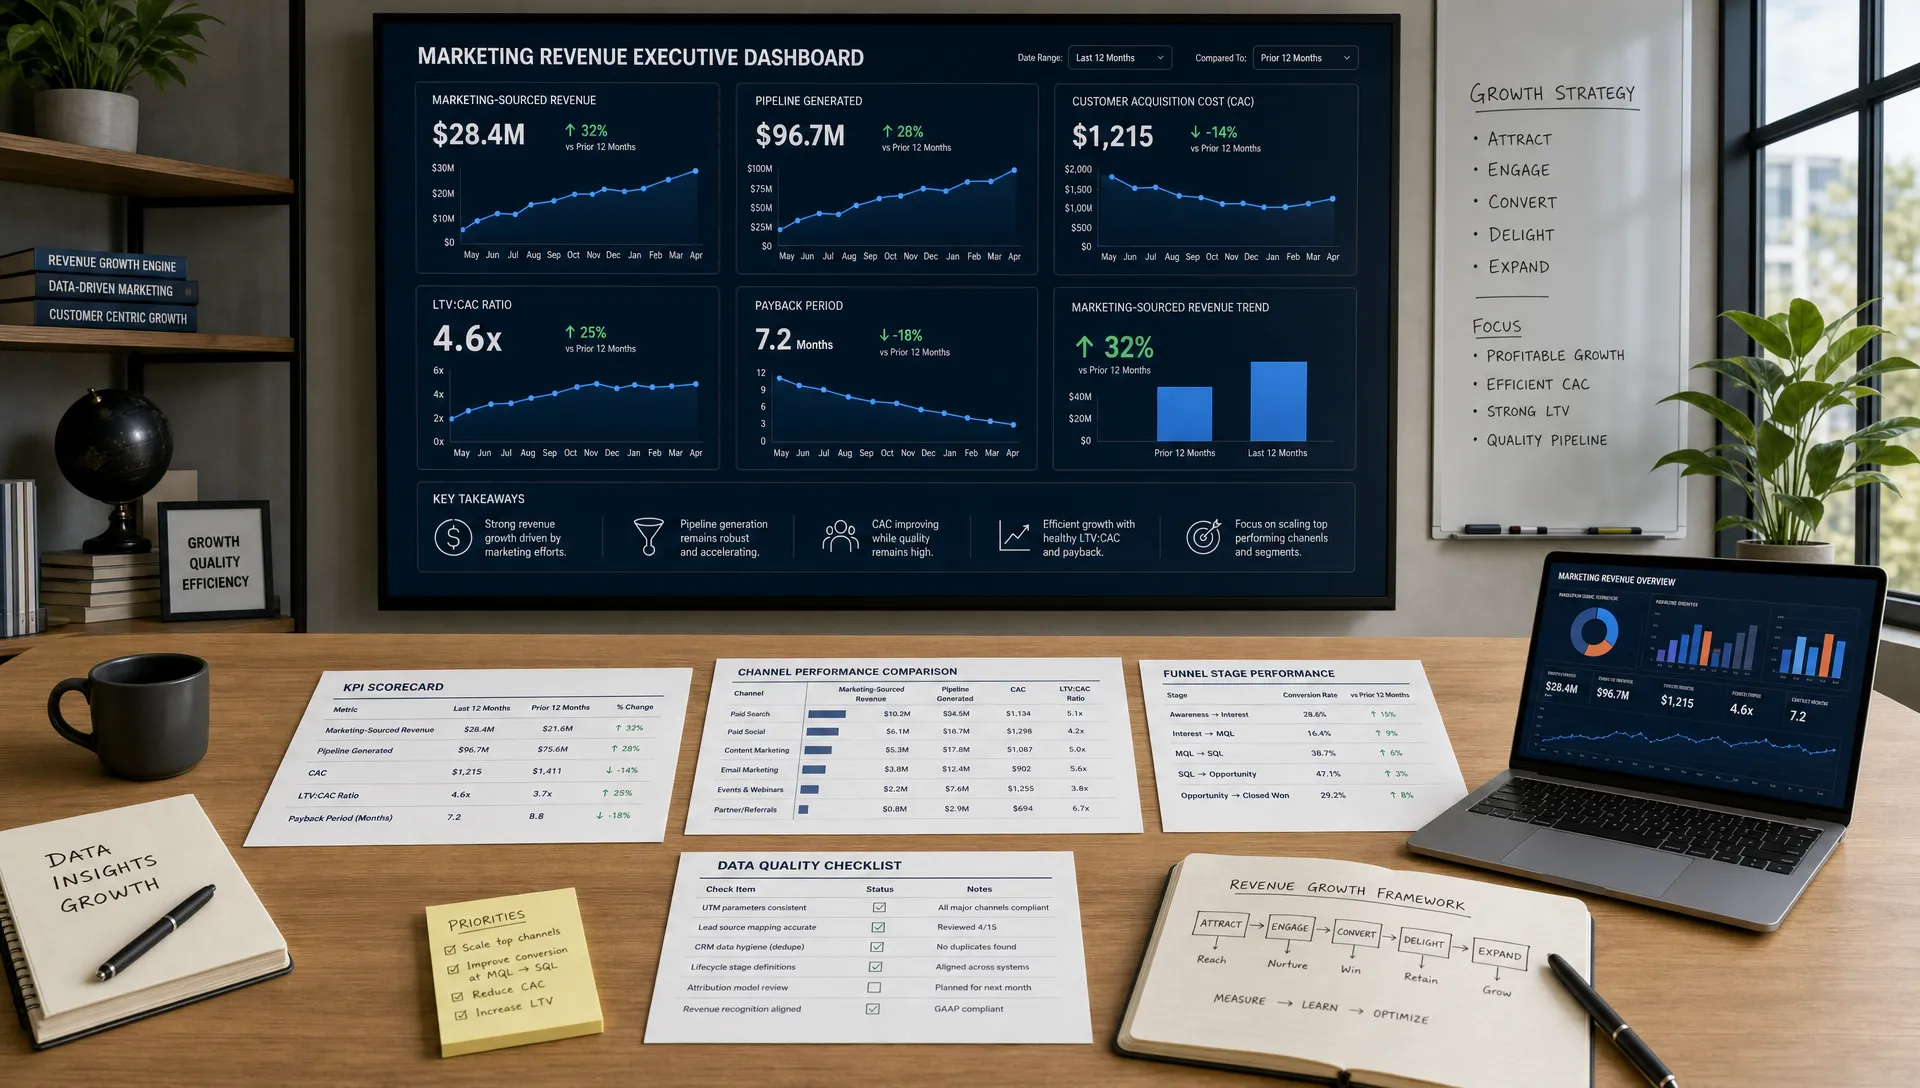
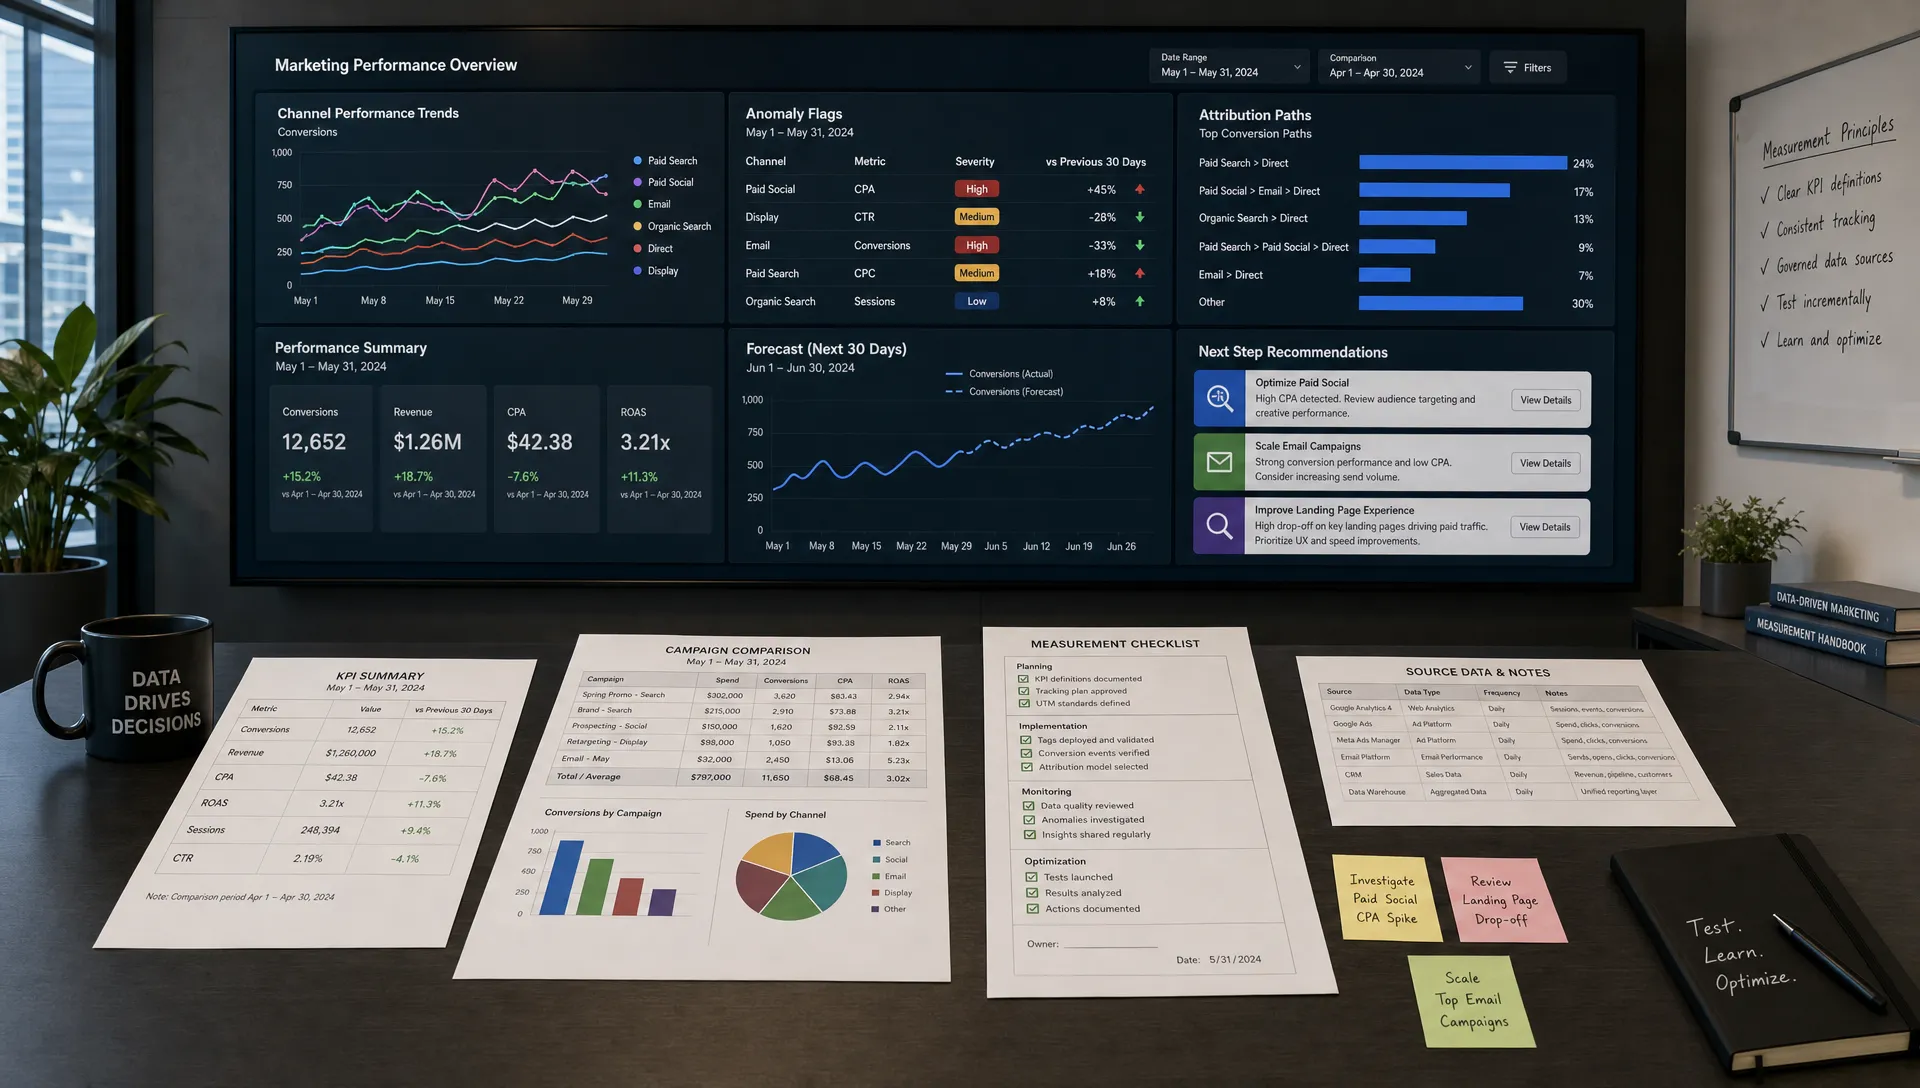
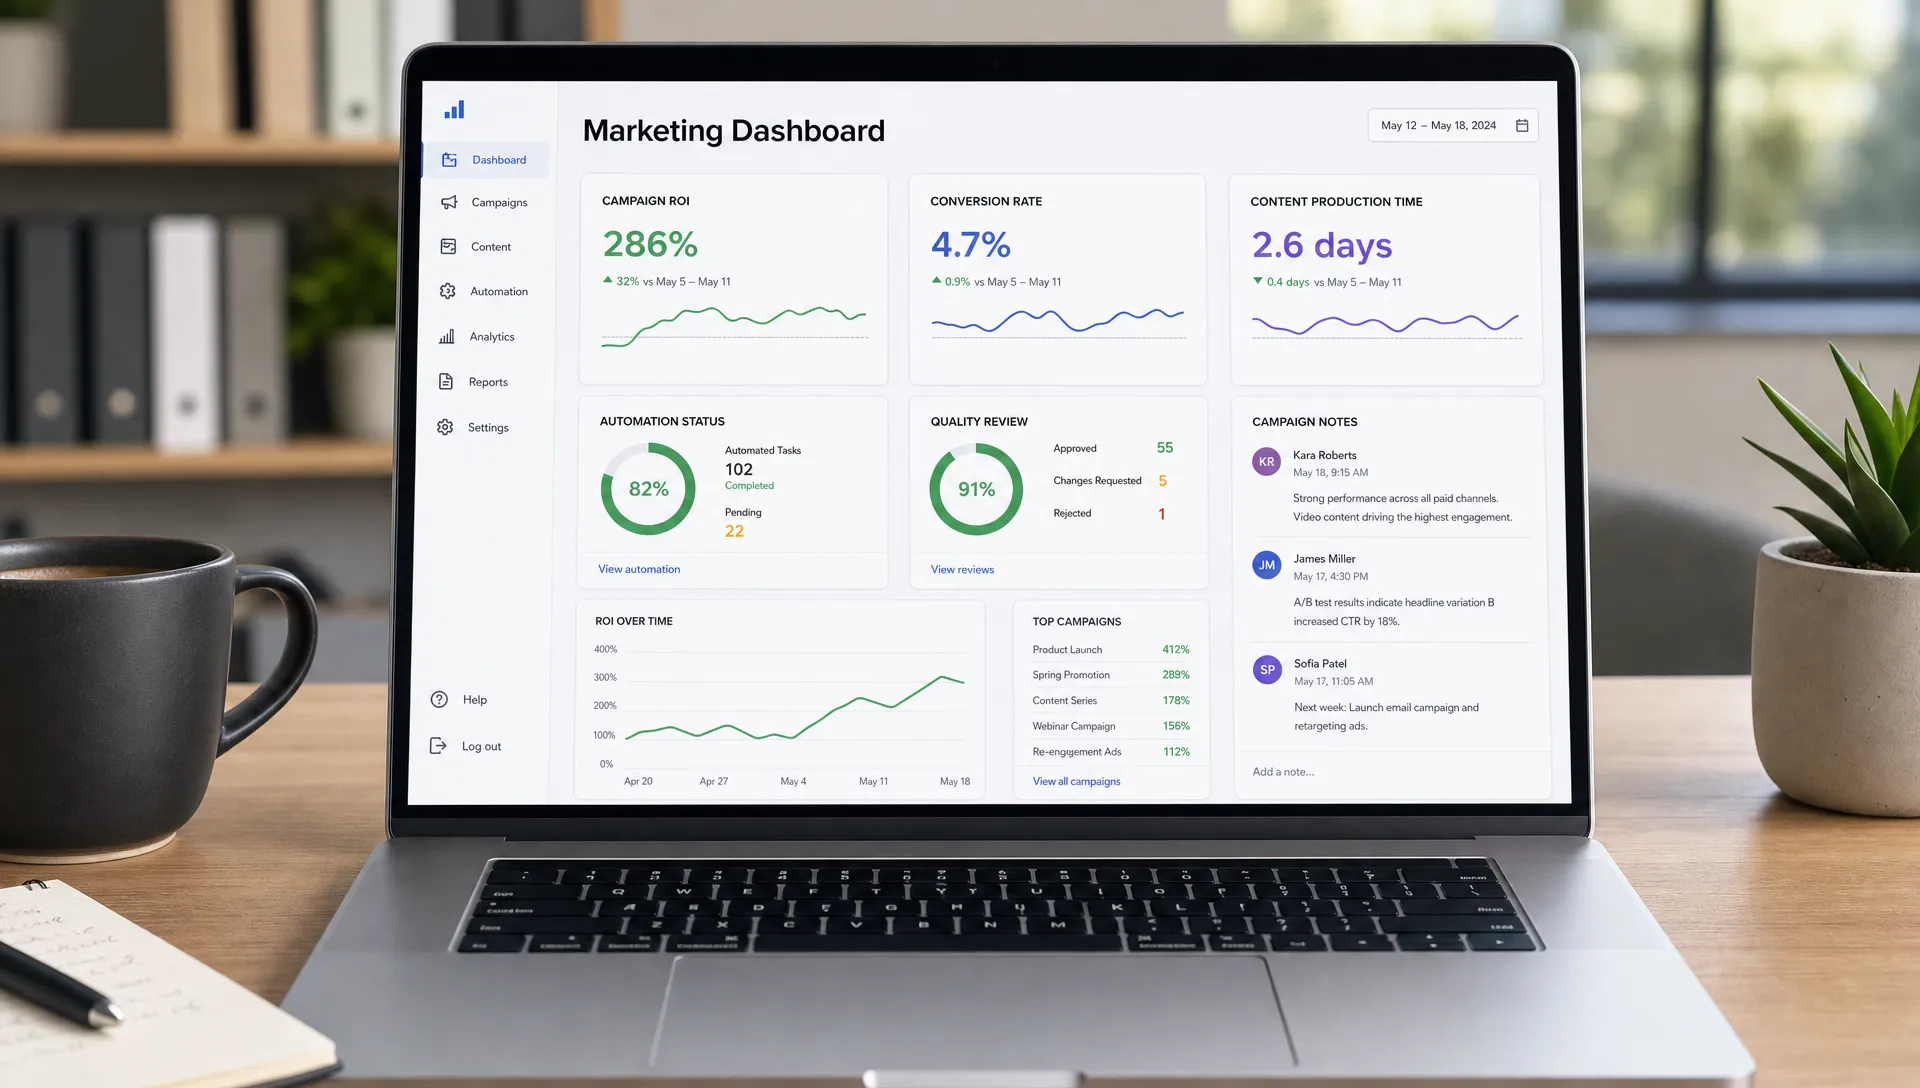
A good dashboard should be simple enough to review weekly and complete enough to guide decisions. Start with a small set of metrics rather than building a bloated report.
For most teams, a practical AI marketing dashboard includes:
Review operational metrics weekly and strategic metrics monthly. Weekly reviews are best for workflow problems, campaign optimization, and content quality. Monthly reviews are better for revenue trends, CAC, pipeline, and larger budget decisions.
The most important habit is turning metrics into action. Every dashboard review should end with a decision, such as refining prompts, pausing a workflow, shifting budget, updating a QA checklist, or scaling a successful campaign.
The biggest mistake is measuring AI activity instead of AI impact. Prompt volume, generated word count, and number of automated tasks may be interesting, but they do not prove business value on their own.
Another common mistake is measuring AI in isolation. AI usually works inside a broader system that includes humans, data, tools, channels, and customer behavior. If performance changes, look at the full workflow before crediting or blaming the AI tool.
Teams also get into trouble when they ignore quality controls. AI can produce confident language that still needs verification. That is why factual accuracy, brand consistency, and risk flags deserve a place in your scorecard.
Finally, avoid setting permanent metrics too early. Your first AI dashboard should evolve as your maturity grows. Early-stage teams may focus on adoption and cycle time. Advanced teams may focus more on incremental lift, predictive analytics, and cross-channel optimization.
What are AI marketing metrics? AI marketing metrics are measurements that show how AI tools and workflows affect marketing outcomes, including revenue, efficiency, campaign performance, content quality, automation reliability, and risk management.
Which AI marketing metric should teams track first? Start with one business outcome, such as CAC, marketing-sourced pipeline, or AI-influenced revenue. Then add supporting metrics for efficiency and quality so you can see whether AI is improving performance in a sustainable way.
How do you measure ROI from AI marketing tools? Measure the financial value created by AI-assisted workflows, then compare it with tool costs, labor costs, implementation time, and quality control effort. Include both revenue gains and cost savings, but avoid claiming credit without a clear attribution method.
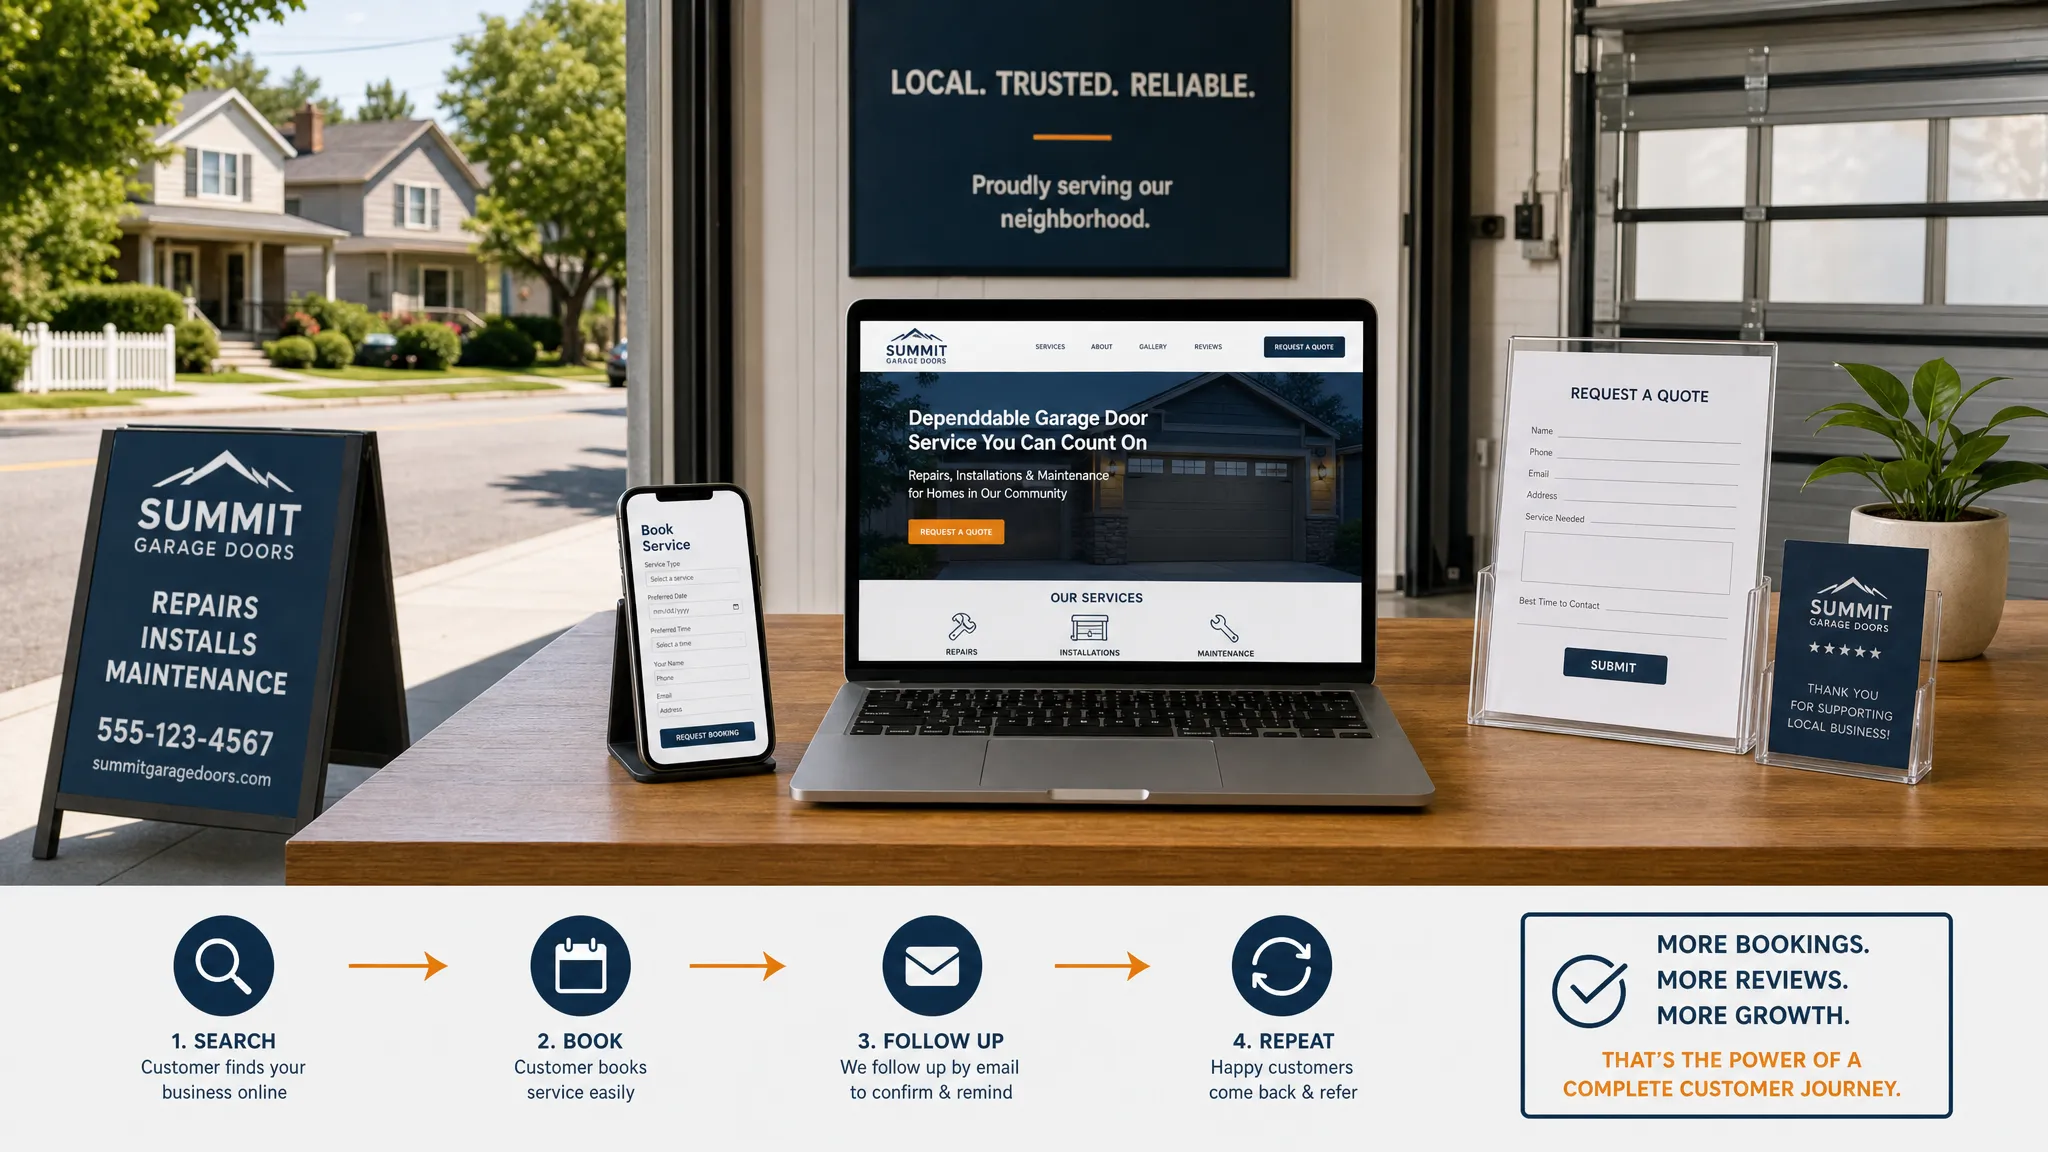
Should every marketing team use the same AI metrics? No. A B2B SaaS team, ecommerce brand, agency, and local service business may need different scorecards. The best metrics depend on your funnel, sales cycle, channels, risk level, and AI maturity.
How often should AI marketing metrics be reviewed? Review workflow, quality, and campaign metrics weekly. Review revenue, CAC, pipeline, and strategic ROI monthly or quarterly, depending on your sales cycle and campaign volume.
AI marketing works best when teams measure what matters, not just what is easy to count. The right scorecard connects automation to outcomes, protects brand trust, and helps marketers improve faster with every campaign.
If you are building a more data-driven AI marketing workflow, AIMarketer Hub offers practical guides, AI tools, calculators, prompt resources, and marketing insights to help you plan, automate, and optimize with more confidence. Explore more resources on the AIMarketer Hub blog and keep refining your measurement system as your AI maturity grows.